Learn Articles
Article
The Four Economic Quads
By Clark Kent for MrFlourish Invests
The market does not pay you for saying growth is “strong” or inflation is “high.” It moves when those forces change speed.
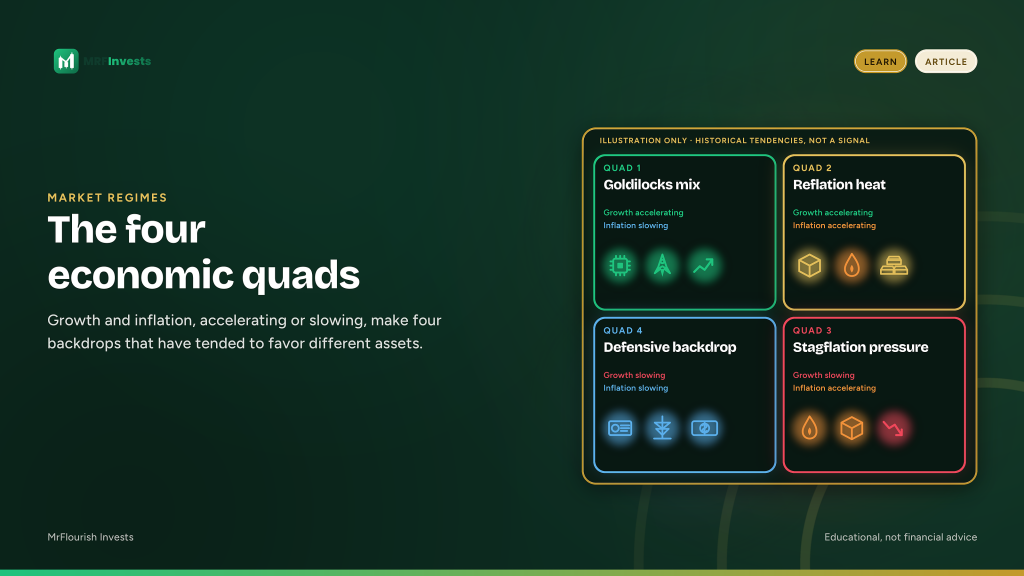
Ask two questions. Is growth accelerating or slowing? Is inflation accelerating or slowing? Cross the answers and you get four regimes. Investors call them the four economic quads.
This lesson hands you the map. Use it as a lens for sector and asset tilts, and for risk. It is not a trading signal, and it is not a call on the regime we are in now. The patterns below have tended to show up. That is not a guarantee they will show up again.
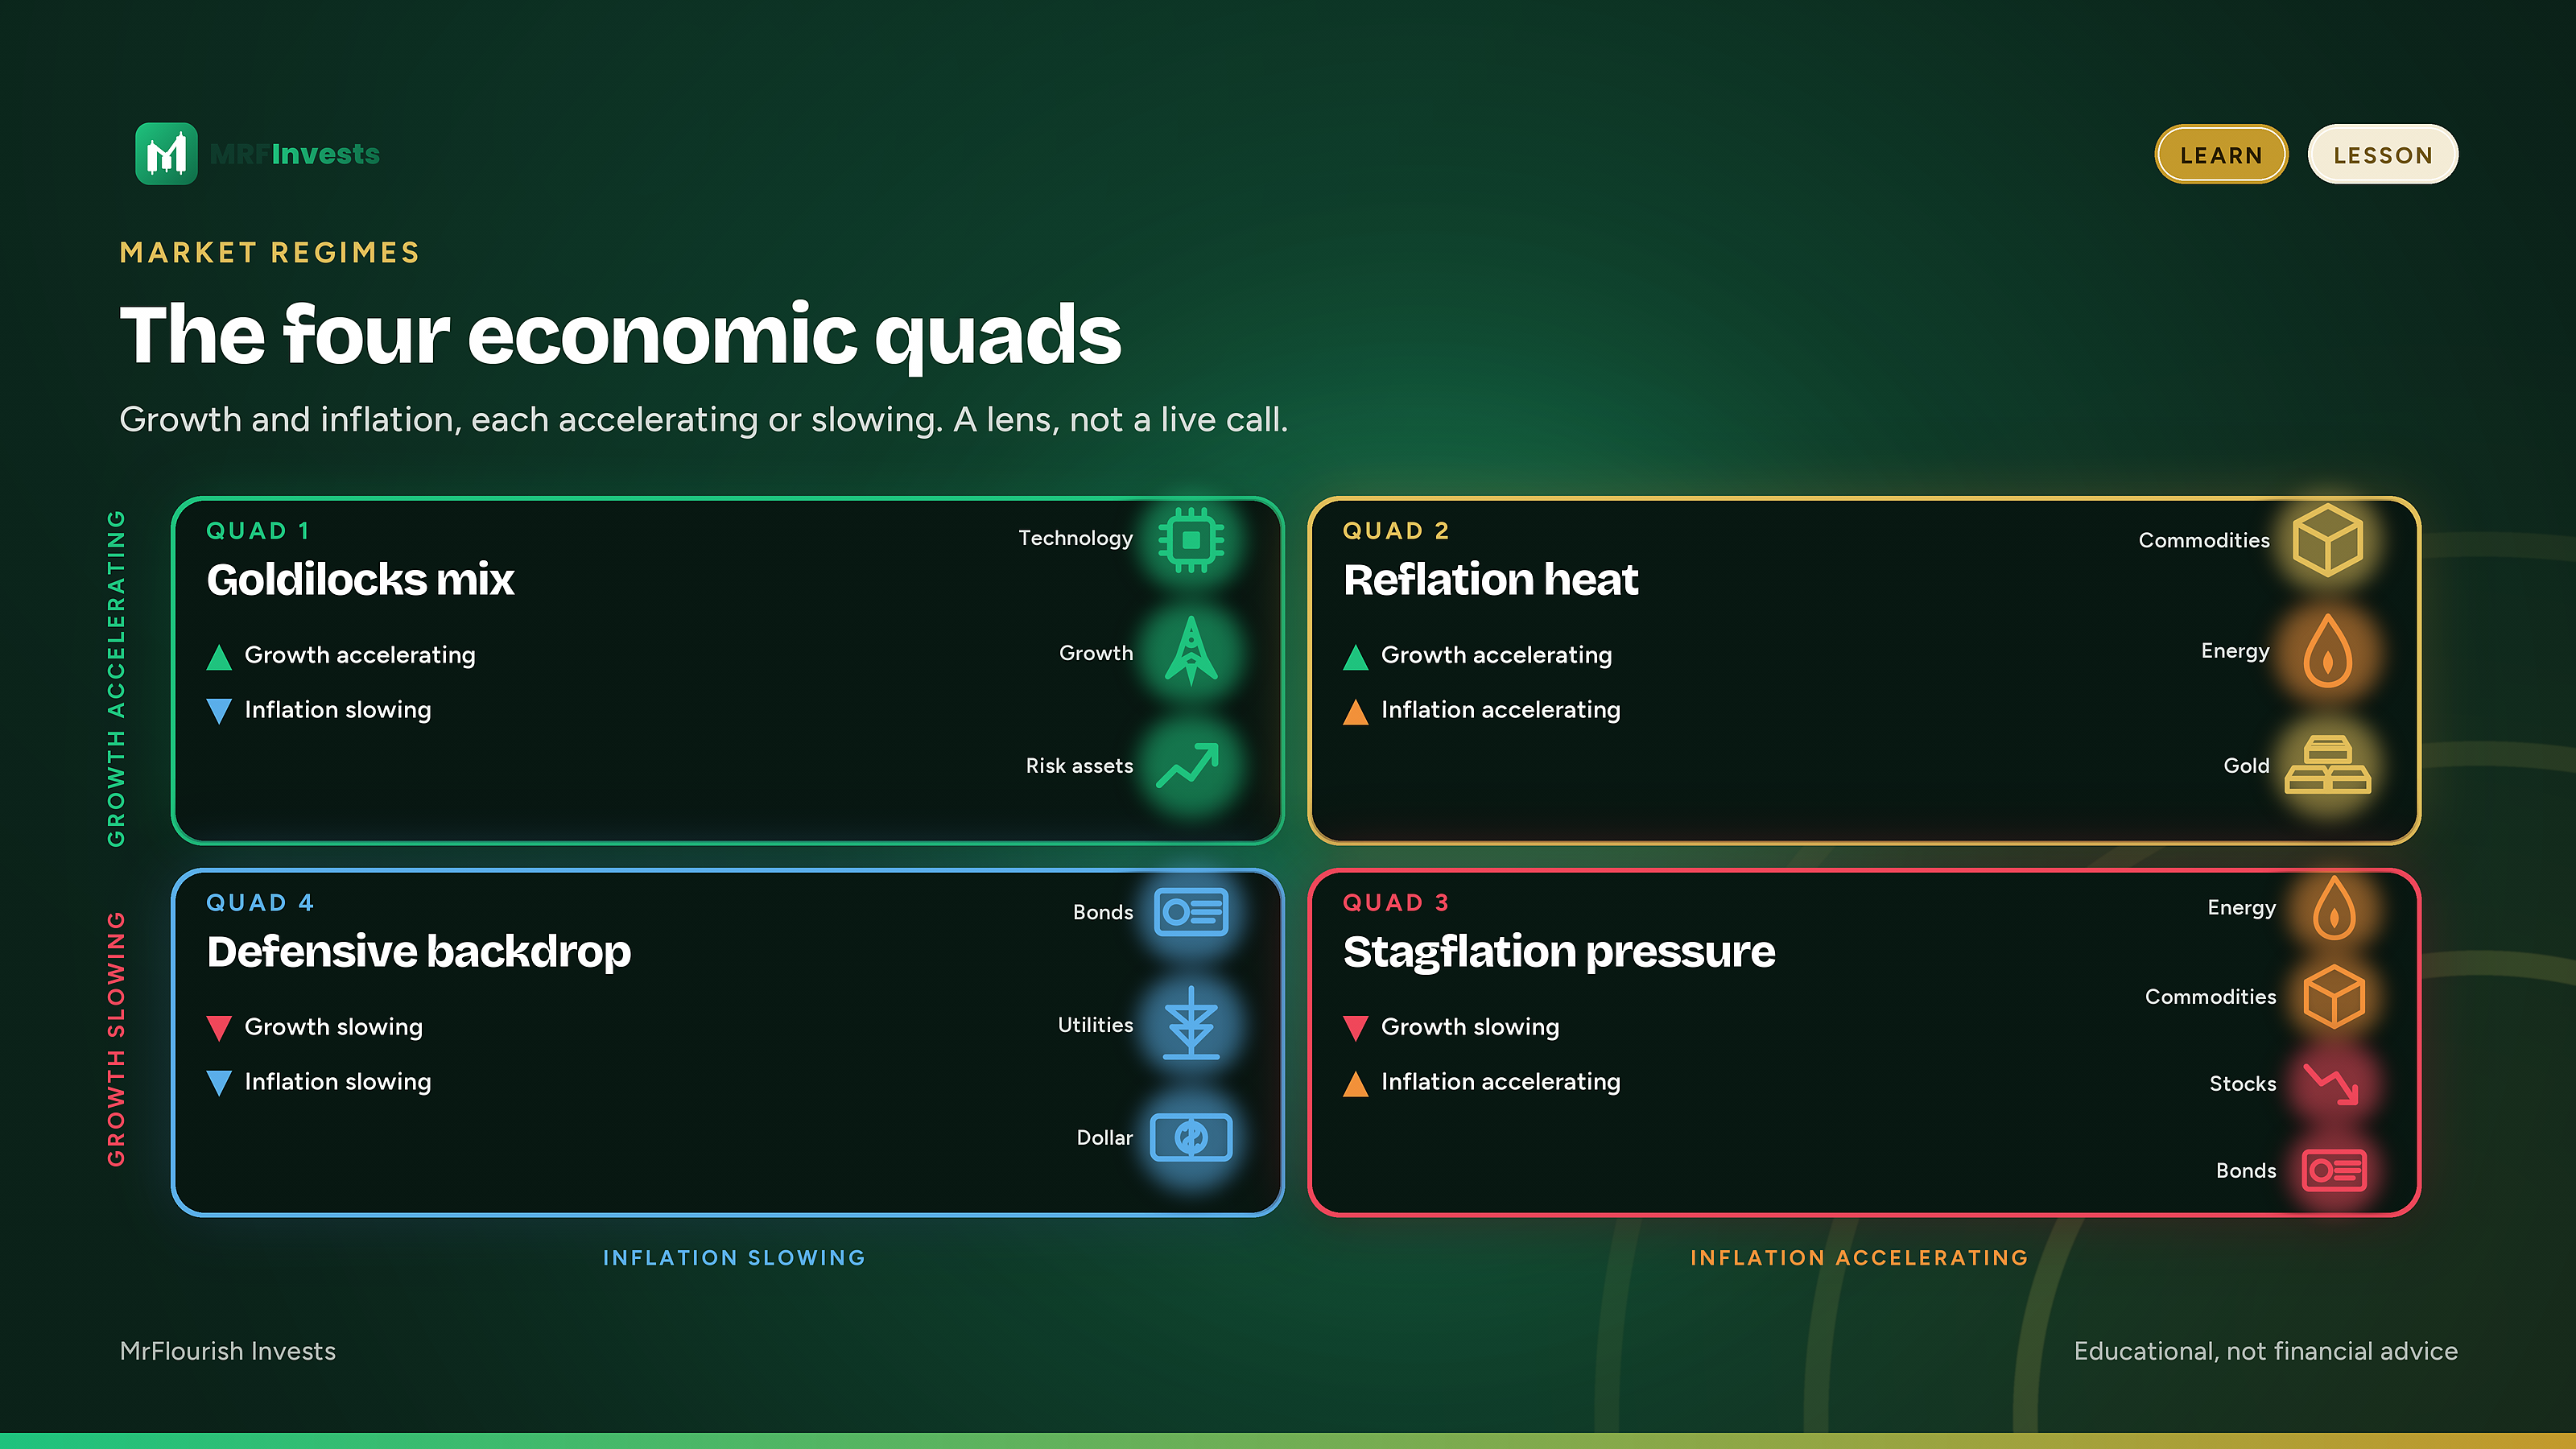
The map at a glance
- Quad 1, the sweet spot: growth accelerating, inflation slowing. Long-duration growth and technology have tended to do better.
- Quad 2, the heat-up: growth and inflation both accelerating. Commodities and energy have tended to do better.
- Quad 3, the squeeze: growth slowing, inflation accelerating. This is the stagflation-like box. Commodities and energy have tended to hold up better than growth-sensitive assets.
- Quad 4, the cool-down: growth and inflation both slowing. Bonds, utilities, and often the dollar have tended to do better.
Why the rate of change beats the level
People talk about growth and inflation as if the level were the whole story. Markets usually care more about the direction of the change.
A still-elevated inflation rate that is already slowing is a different environment from a lower inflation rate that has just started to pick up. Growth can still be positive and already be decelerating. That slowing is often what prices are digesting.
The level tells you where you stand. The rate of change tells you whether the pressure is building or easing.
Policy often reacts to levels, and it usually does so with a lag. Prices often move at the inflection, when growth or inflation stops getting better or worse at the same pace.
That is why two people can look at the same print and disagree. One describes the level. The other asks whether the figure is accelerating or slowing versus the recent trend. The four-quad framework is built on the second question.
Where the four boxes come from
The version of this map that most investors meet today is the Growth, Inflation, Policy model popularized by Hedgeye and its founder, Keith McCullough. In that model, growth and inflation are each either accelerating or slowing. Policy is then overlaid as the way central banks and governments have often responded to that mix.
A related four-quadrant idea comes from Bridgewater’s All Weather work, associated with Ray Dalio and his colleagues. That framework also starts with growth and inflation, but it asks whether each is rising or falling relative to what markets already expect. It is used to balance a portfolio across those environments rather than to name the one you are in.
The two approaches rhyme. They are not the same model, and this lesson will not treat them as if they were.
What has tended to do better, and worse, in each quad
Once you can name the regime, the practical question is which kinds of assets have tended to be helped or hurt by it. What follows is qualitative, not a scoreboard. It uses no live prices and no historical return figures, and it is not a recommendation to buy or sell any fund.
Quad 1: the sweet spot
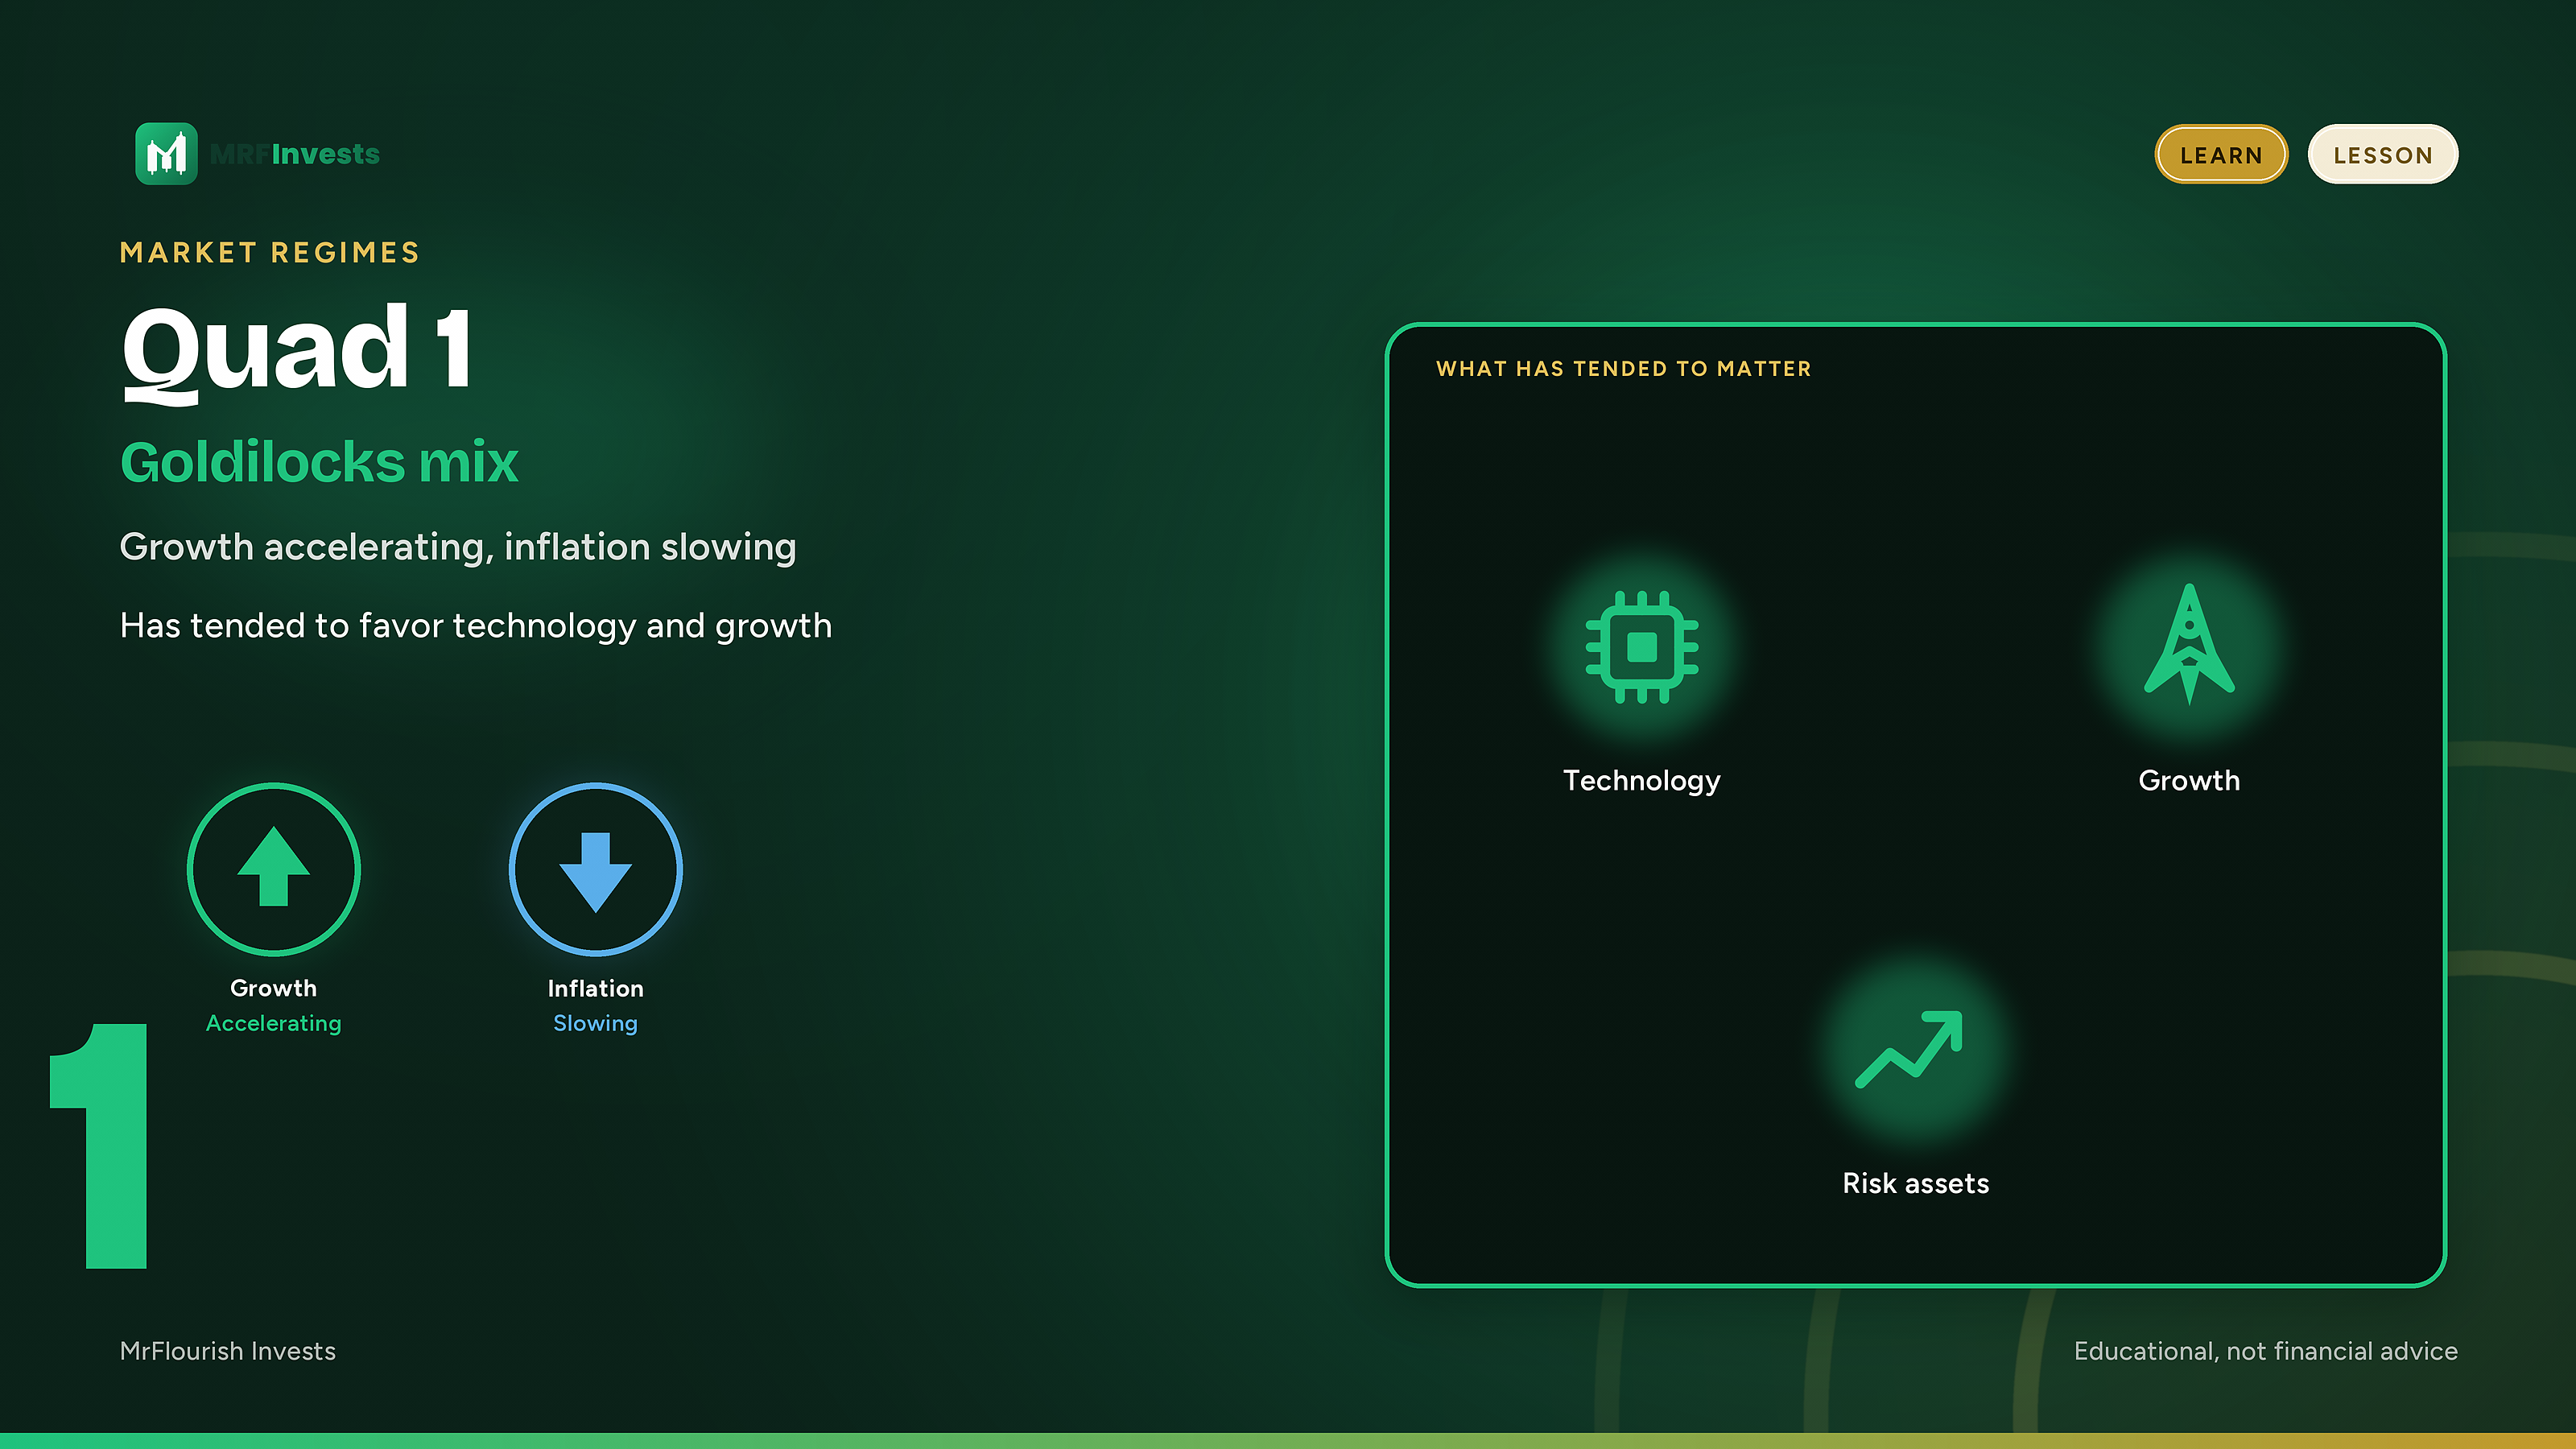
Growth is picking up. Inflation is easing. Real activity improves while price pressure fades. This mix is often described as a friendly backdrop for risk assets.
Long-duration growth businesses and technology have tended to do better here. A technology sector fund such as XLK is a common way people express that idea.
Bonds can also get some help when inflation is slowing, because the inflation worry that weighs on longer-term yields is fading even as growth is still improving.
Assets tied more tightly to rising prices, including many commodities and energy producers, have tended to have less of a tailwind here than they do when inflation itself is accelerating.
Quad 2: the heat-up
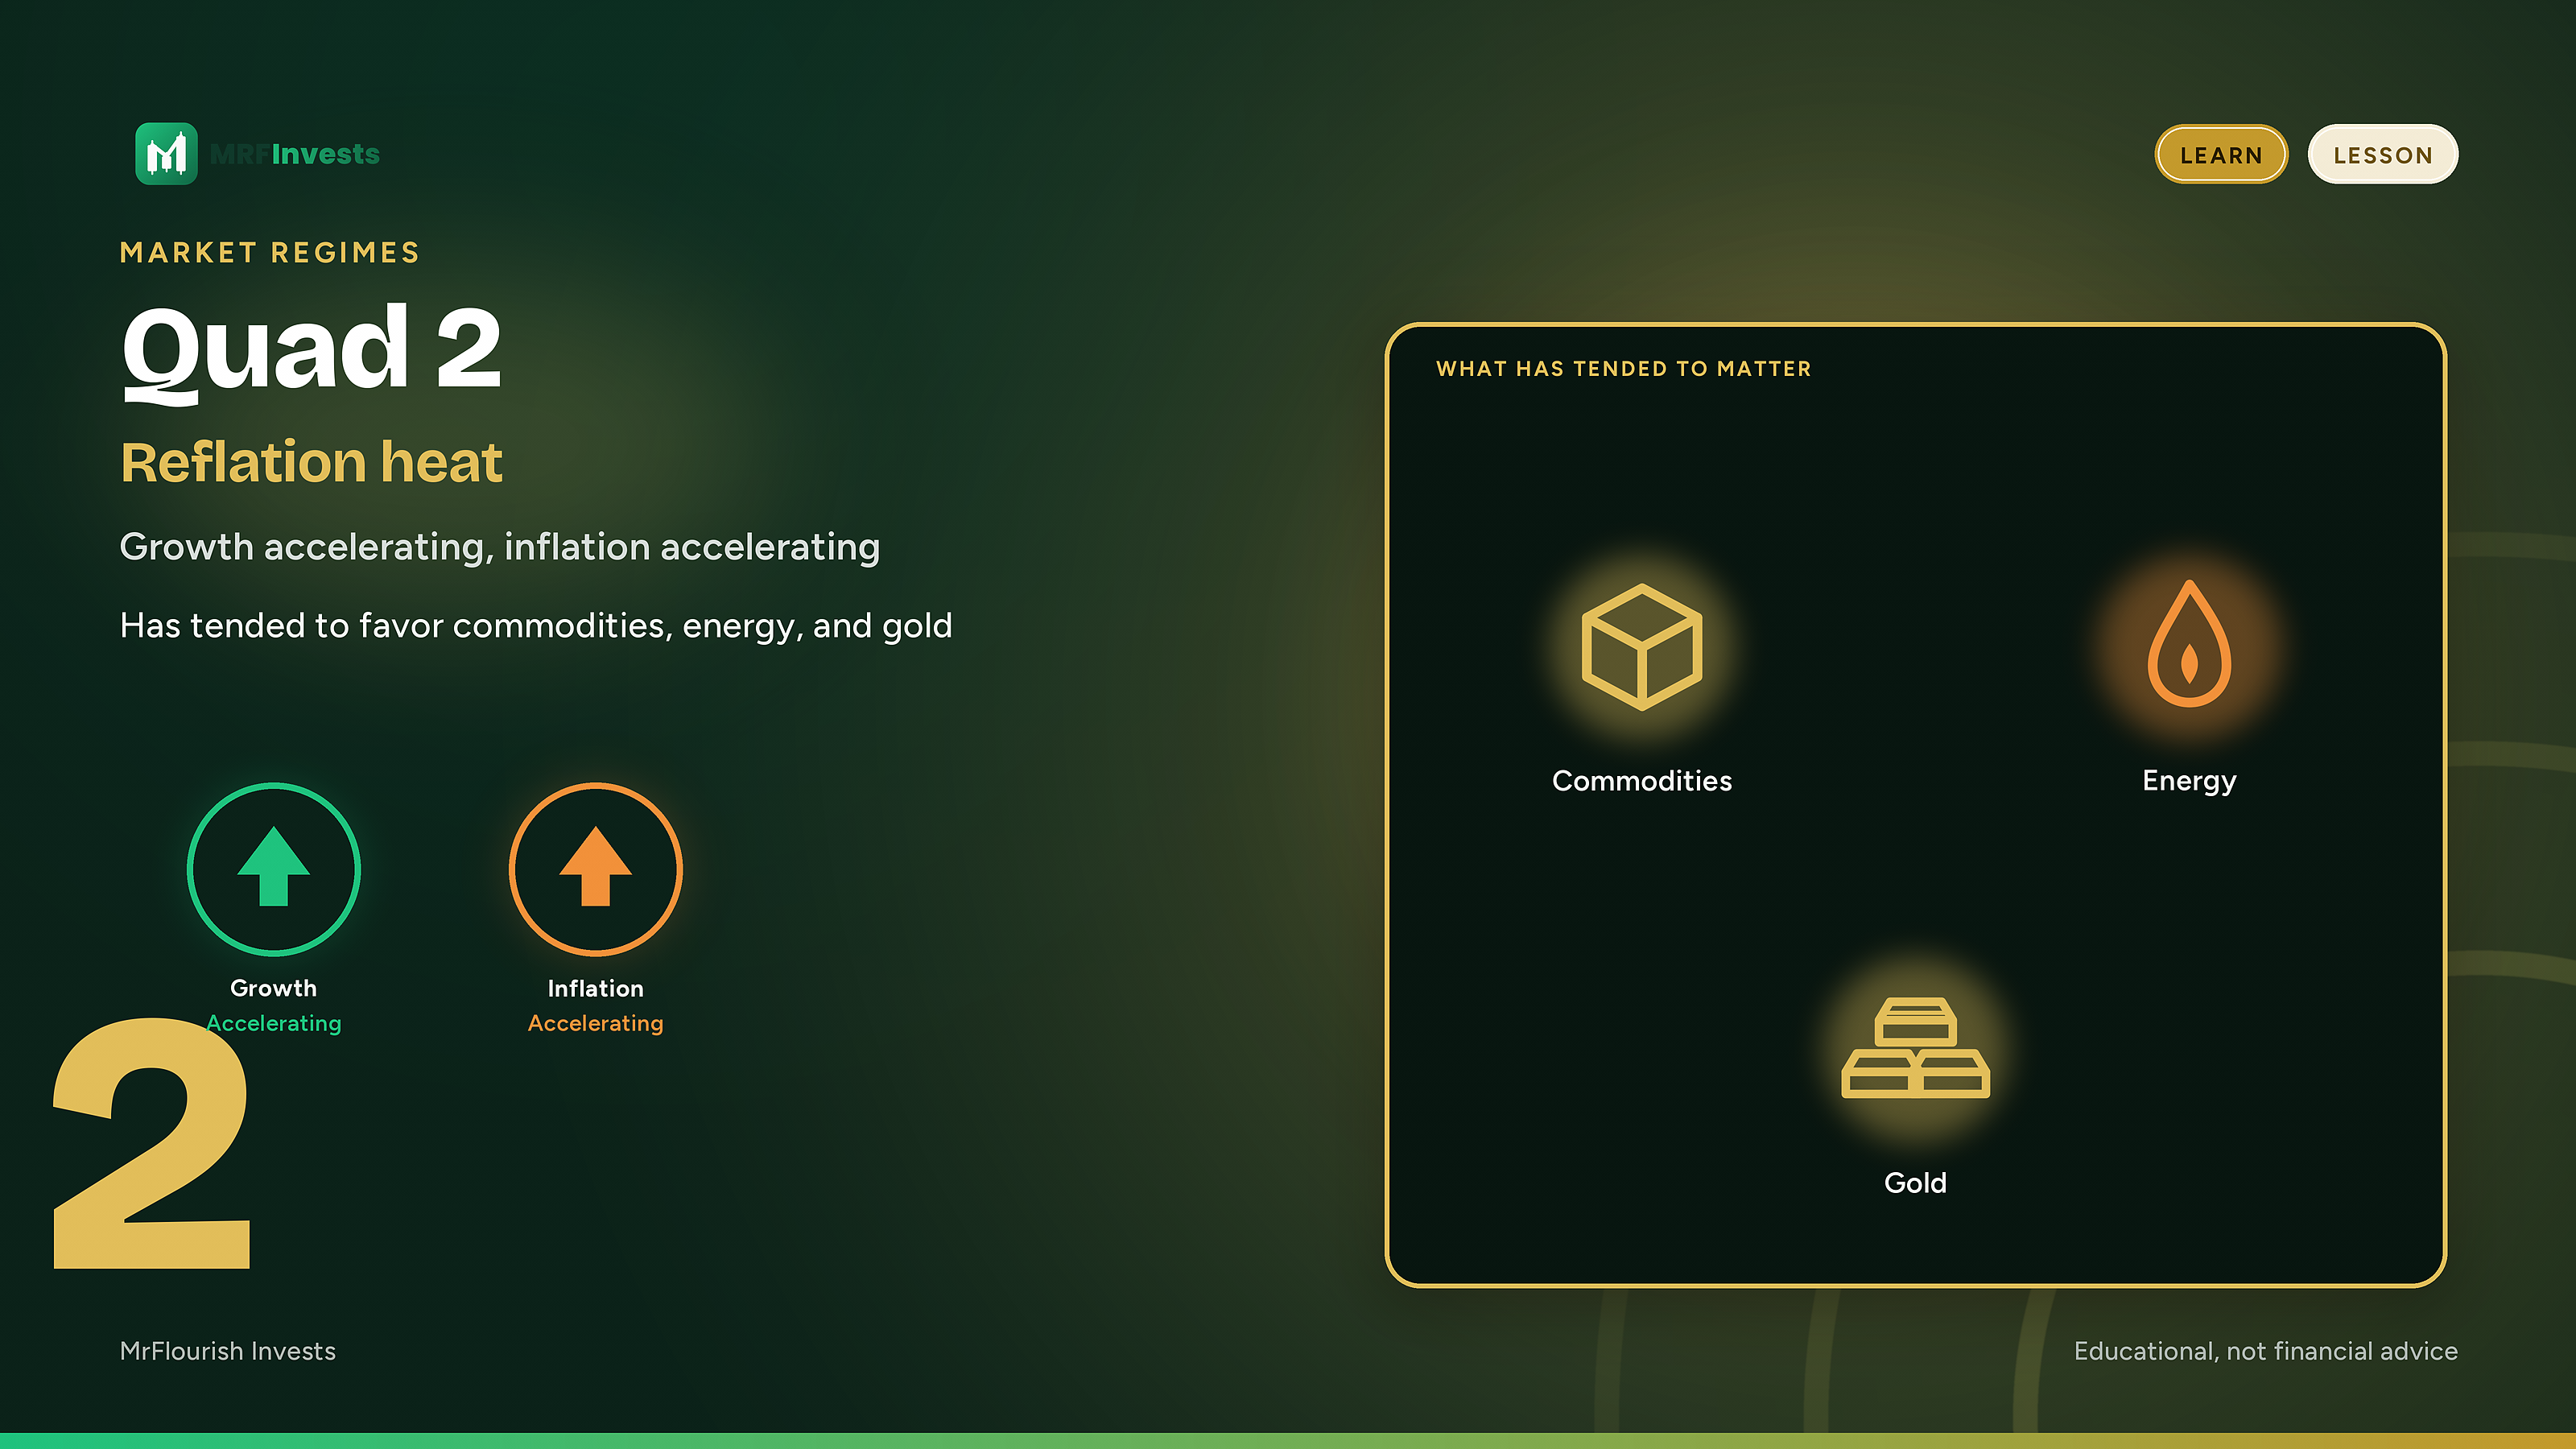
Now the economy is heating up on both fronts. Demand improves and prices rise faster. Investors sometimes call this mix reflation.
Commodities and energy have tended to do better in this regime. An energy sector fund such as XLE, or a gold fund such as GLD, is the kind of exposure investors often associate with that inflation impulse. Gold answers to more than inflation alone.
Longer-term bonds have tended to have a harder time. Accelerating inflation is one of the conditions that can push yields higher and prices lower. A long Treasury fund such as TLT is a useful picture of that interest-rate sensitivity, not a prediction.
Quad 3: the squeeze
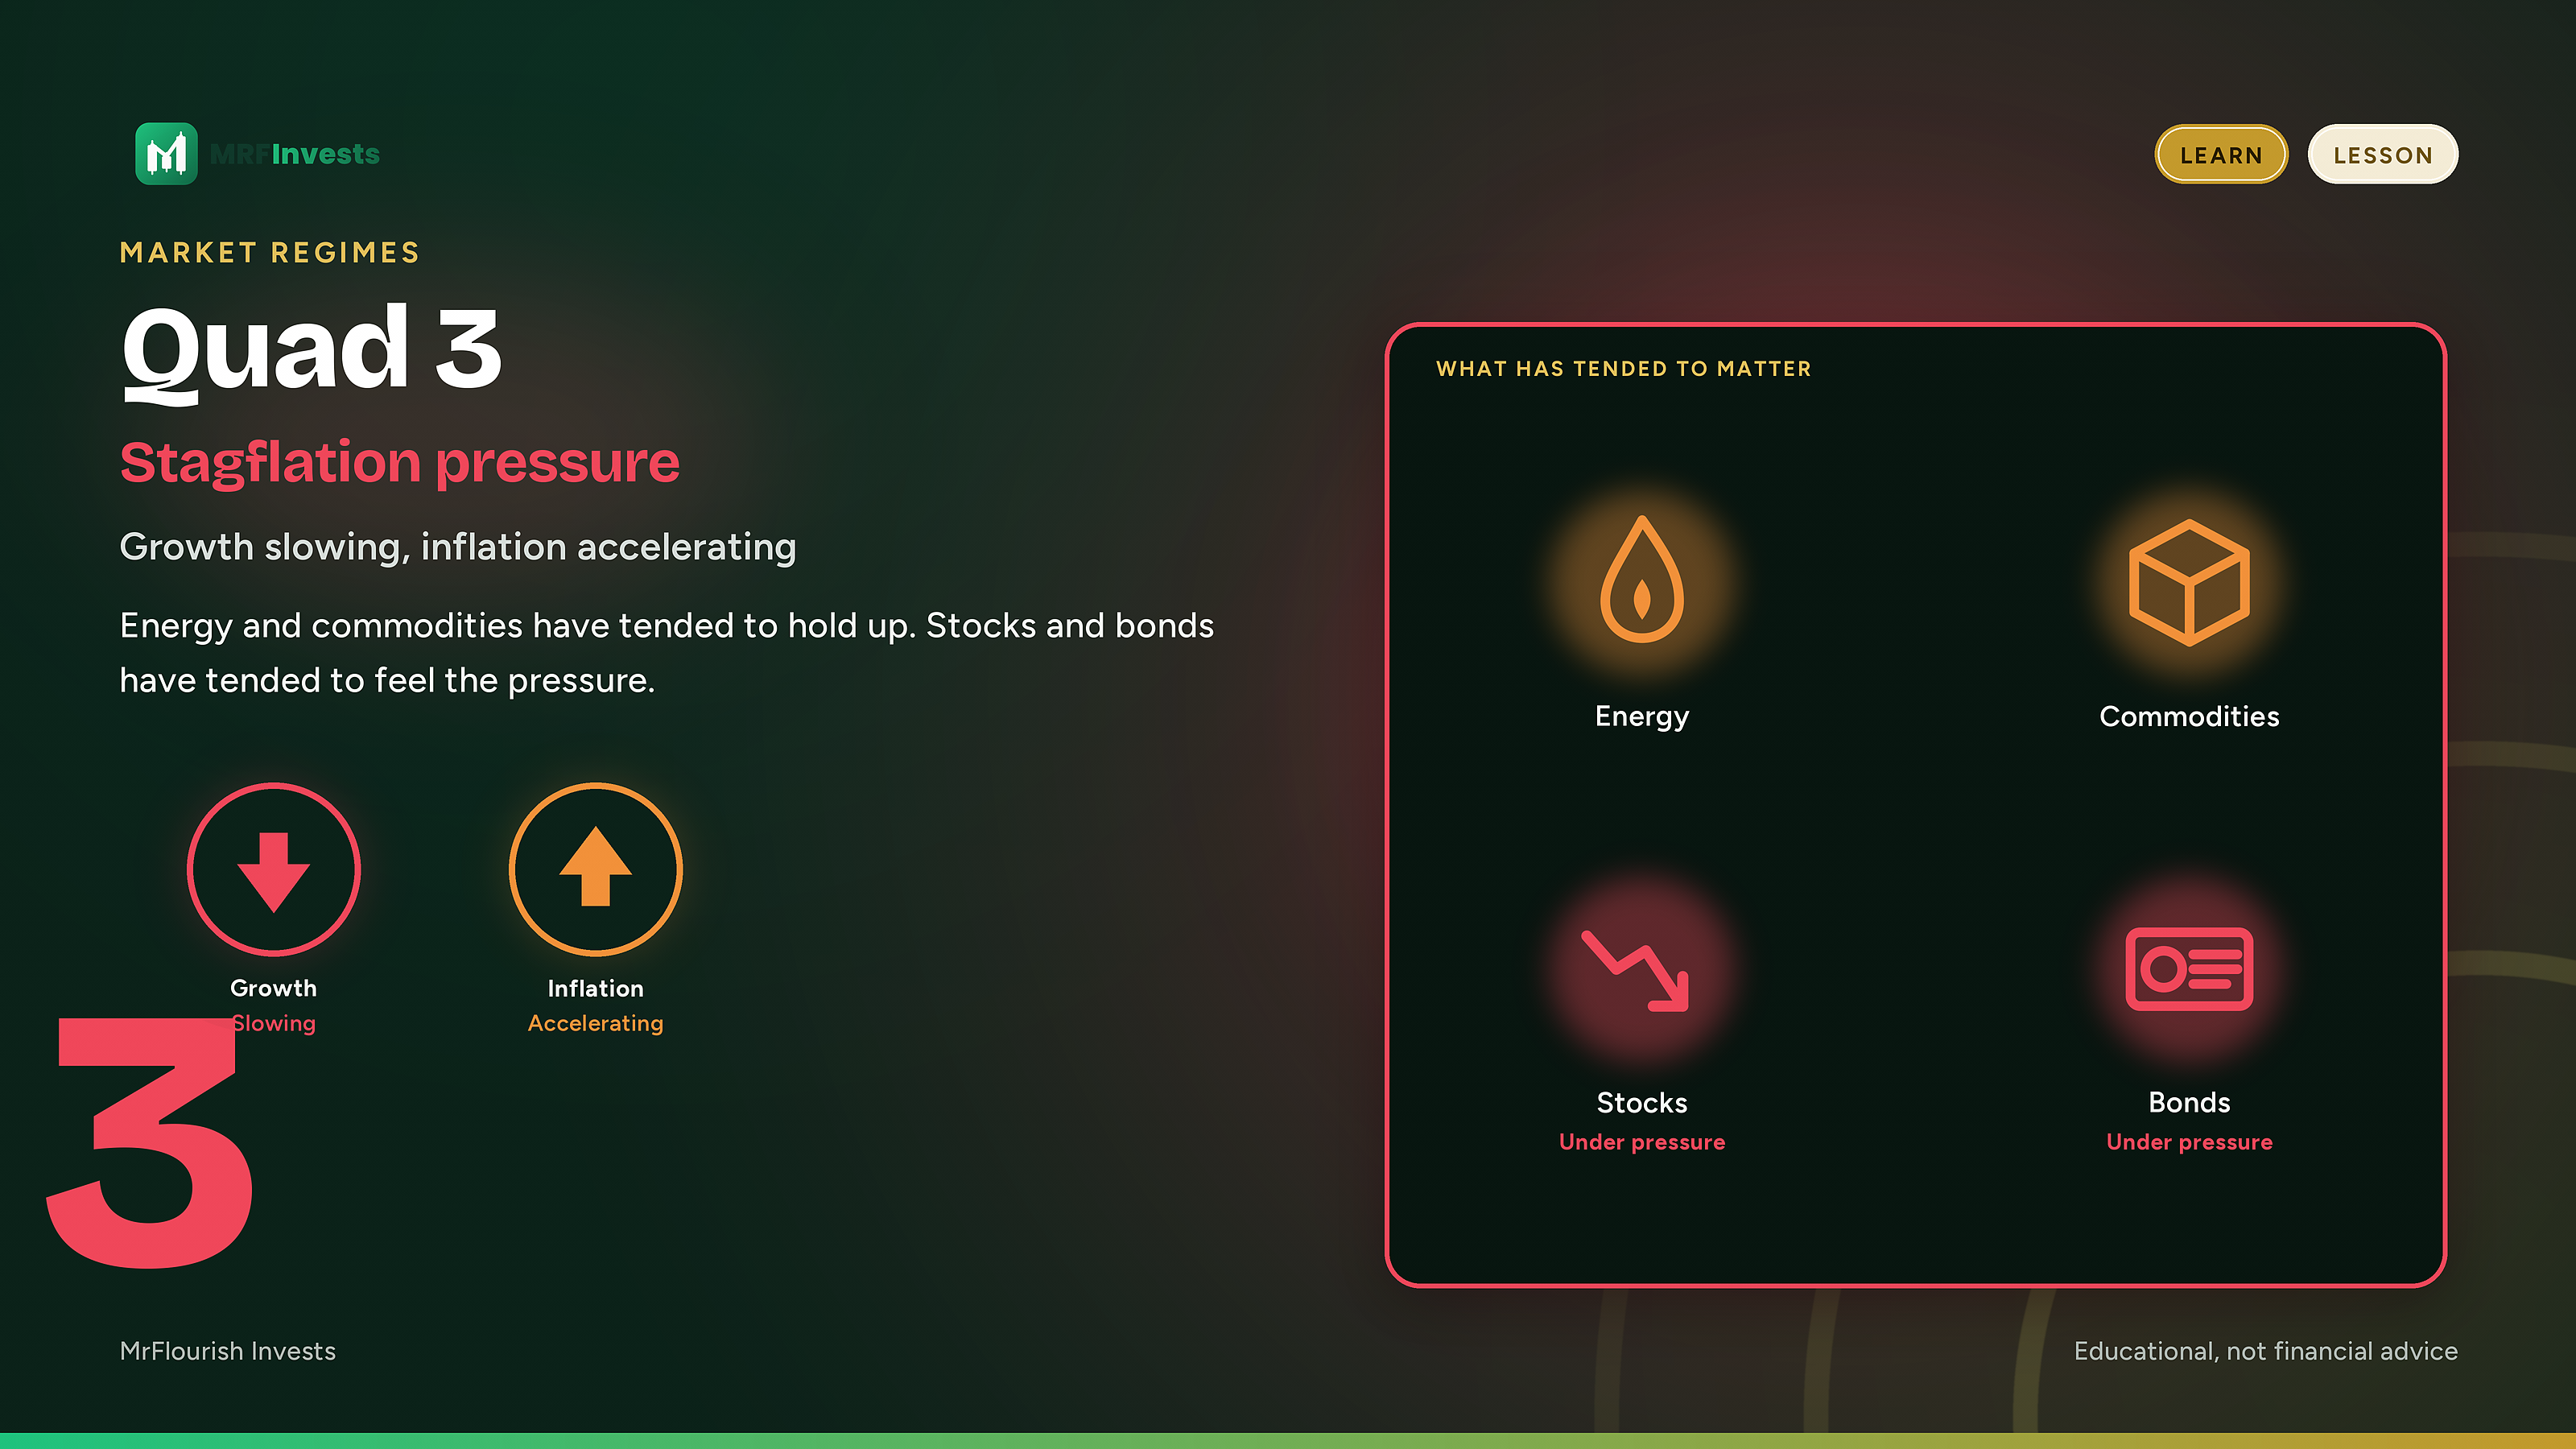
This is the stagflation-like box, and it squeezes a lot of portfolios at once. Activity loses speed while prices are still accelerating. The usual shock absorbers do not all work together.
Equities, especially long-duration growth and technology, have tended to struggle when growth is slowing. Bonds can struggle too if inflation is still picking up.
The parts of the market more tied to the “flation” side of that mix, again including commodities and energy, have tended to hold up better than growth-sensitive assets. That tendency is a historical pattern, not a promise that energy or gold will protect a portfolio every time growth cools and inflation does not.
Quad 4: the cool-down
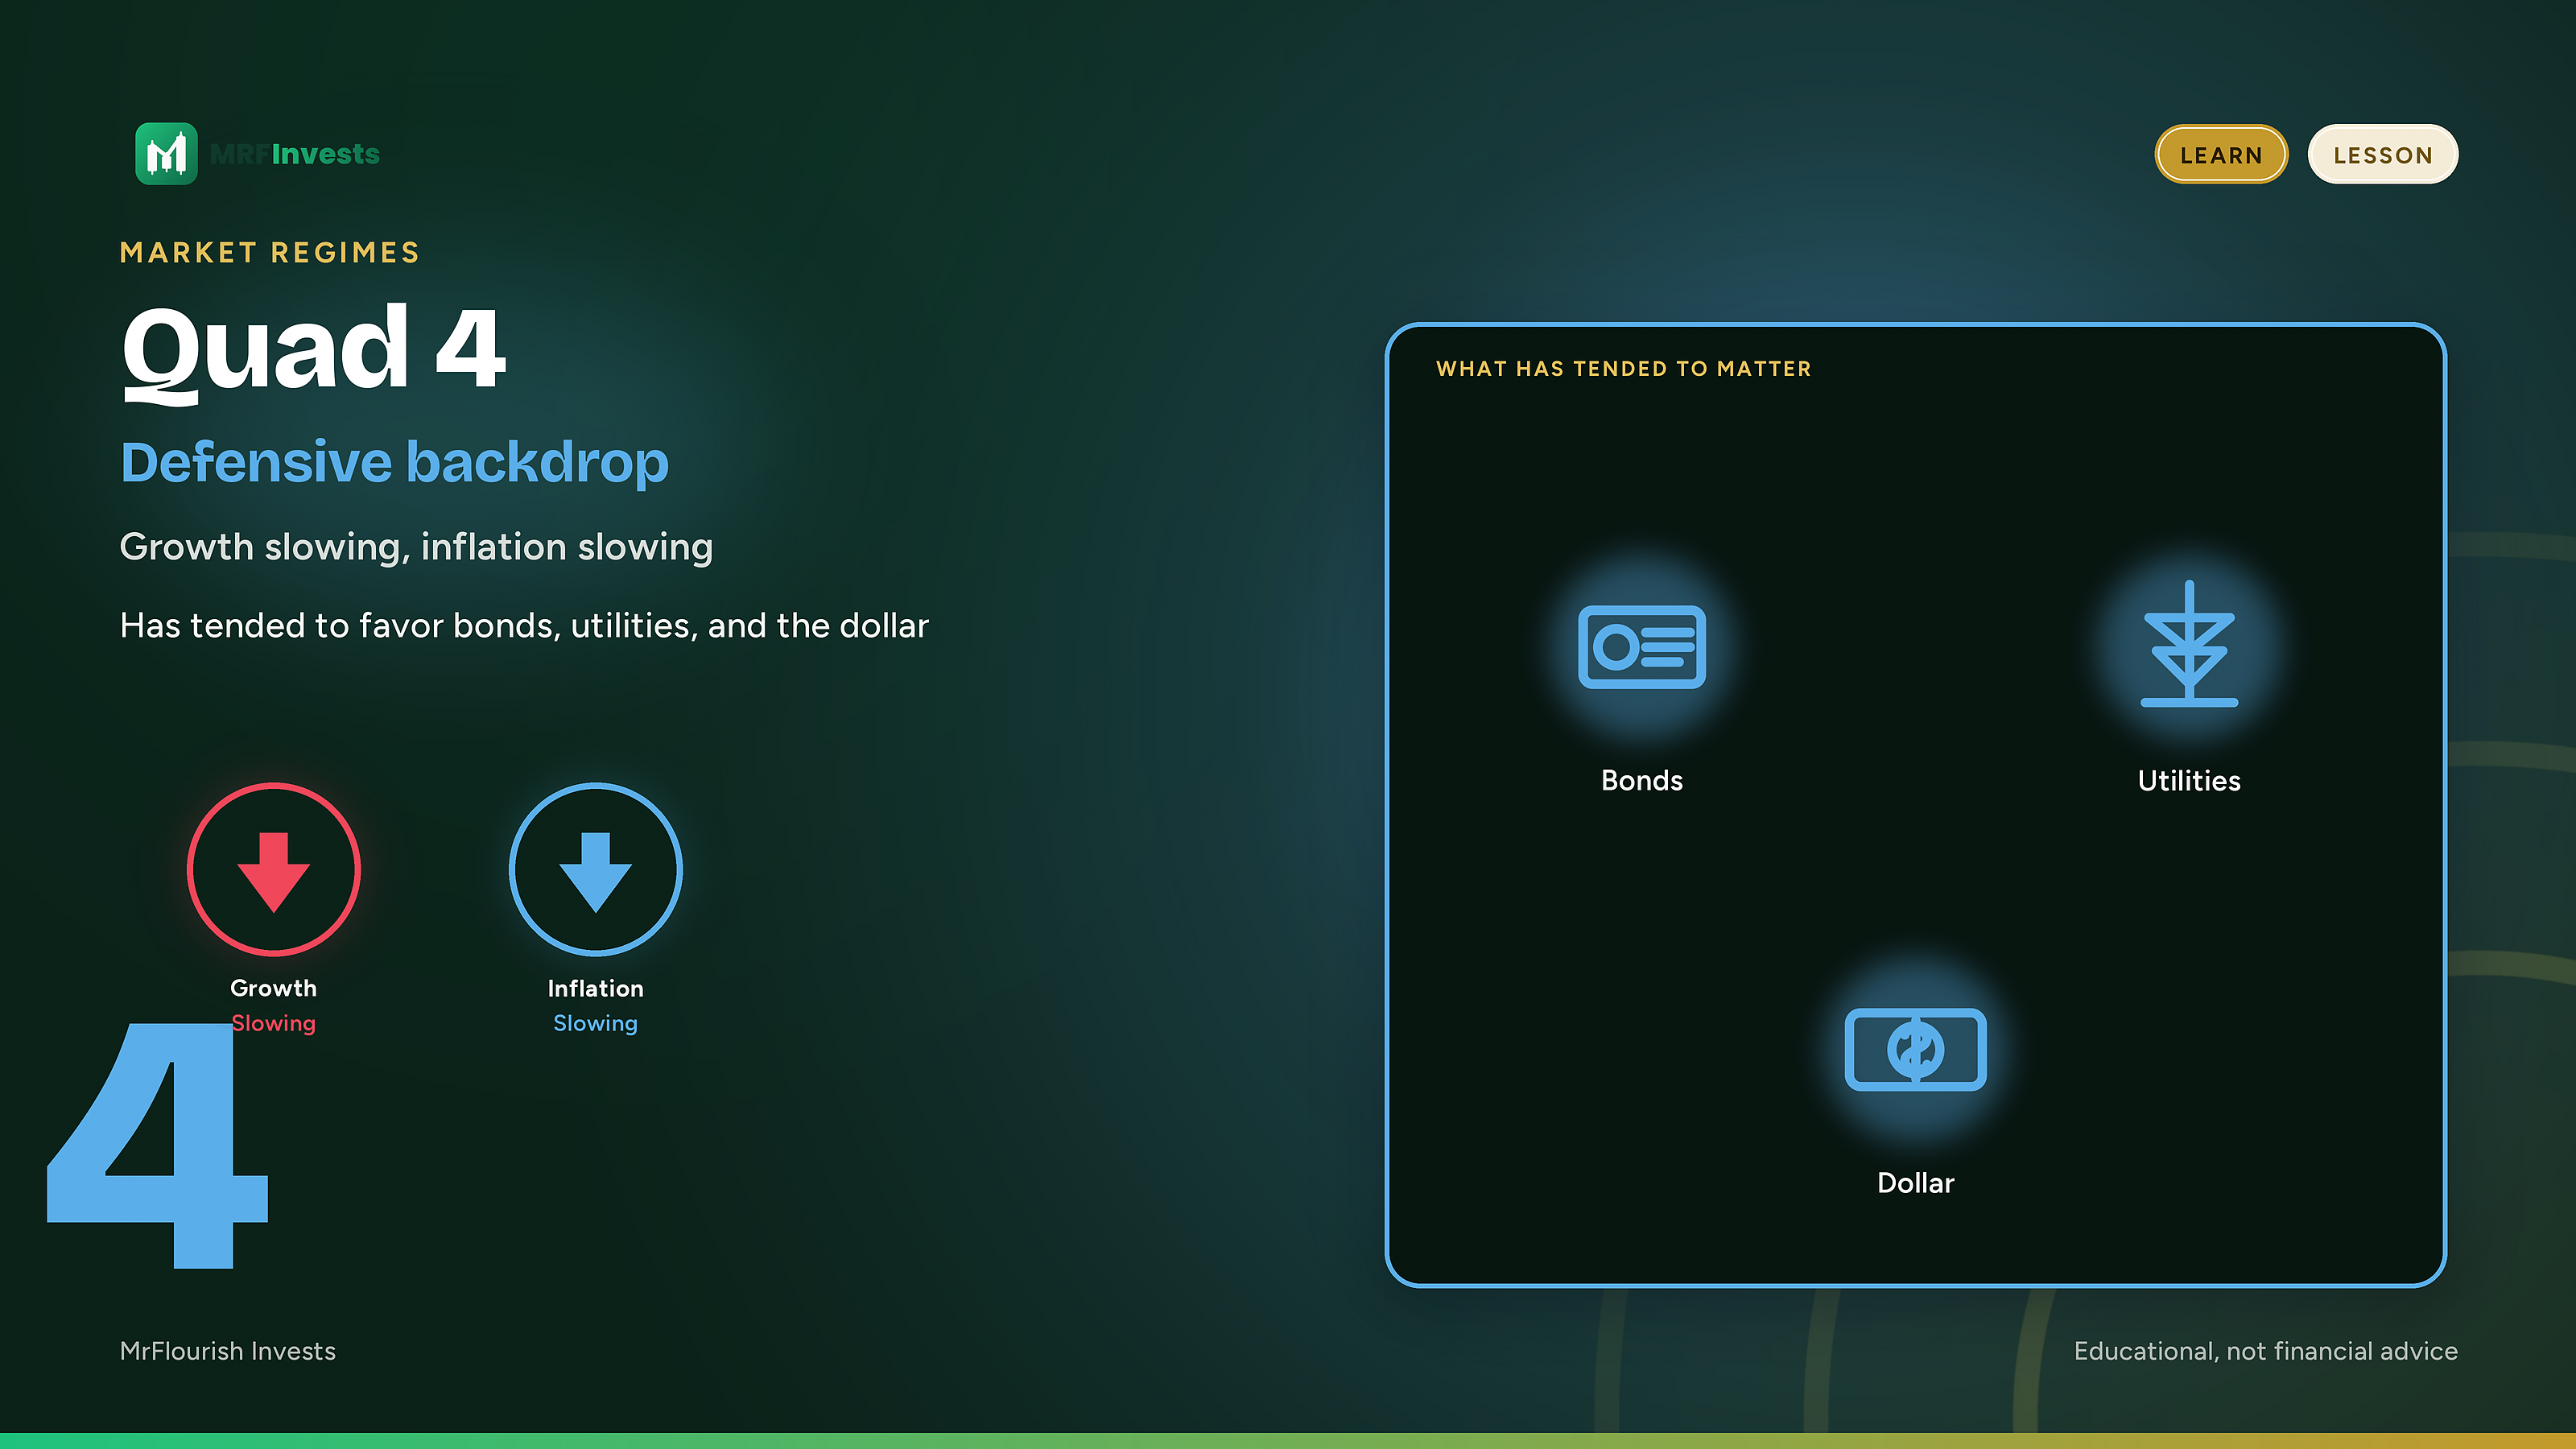
Both growth and inflation are slowing. The heat comes out of the system. The backdrop has tended to favor more defensive assets: high-quality bonds, utilities, and often the U.S. dollar.
A utilities sector fund such as XLU, a long Treasury fund such as TLT, or a dollar fund such as UUP is the kind of example people use for those tilts.
Cyclical assets, commodities, and many growth and technology names have tended to do worse in this box, because both the growth impulse and the inflation impulse are fading. As in every other quad, that is a tendency, not a rule.
Why no quad lasts forever
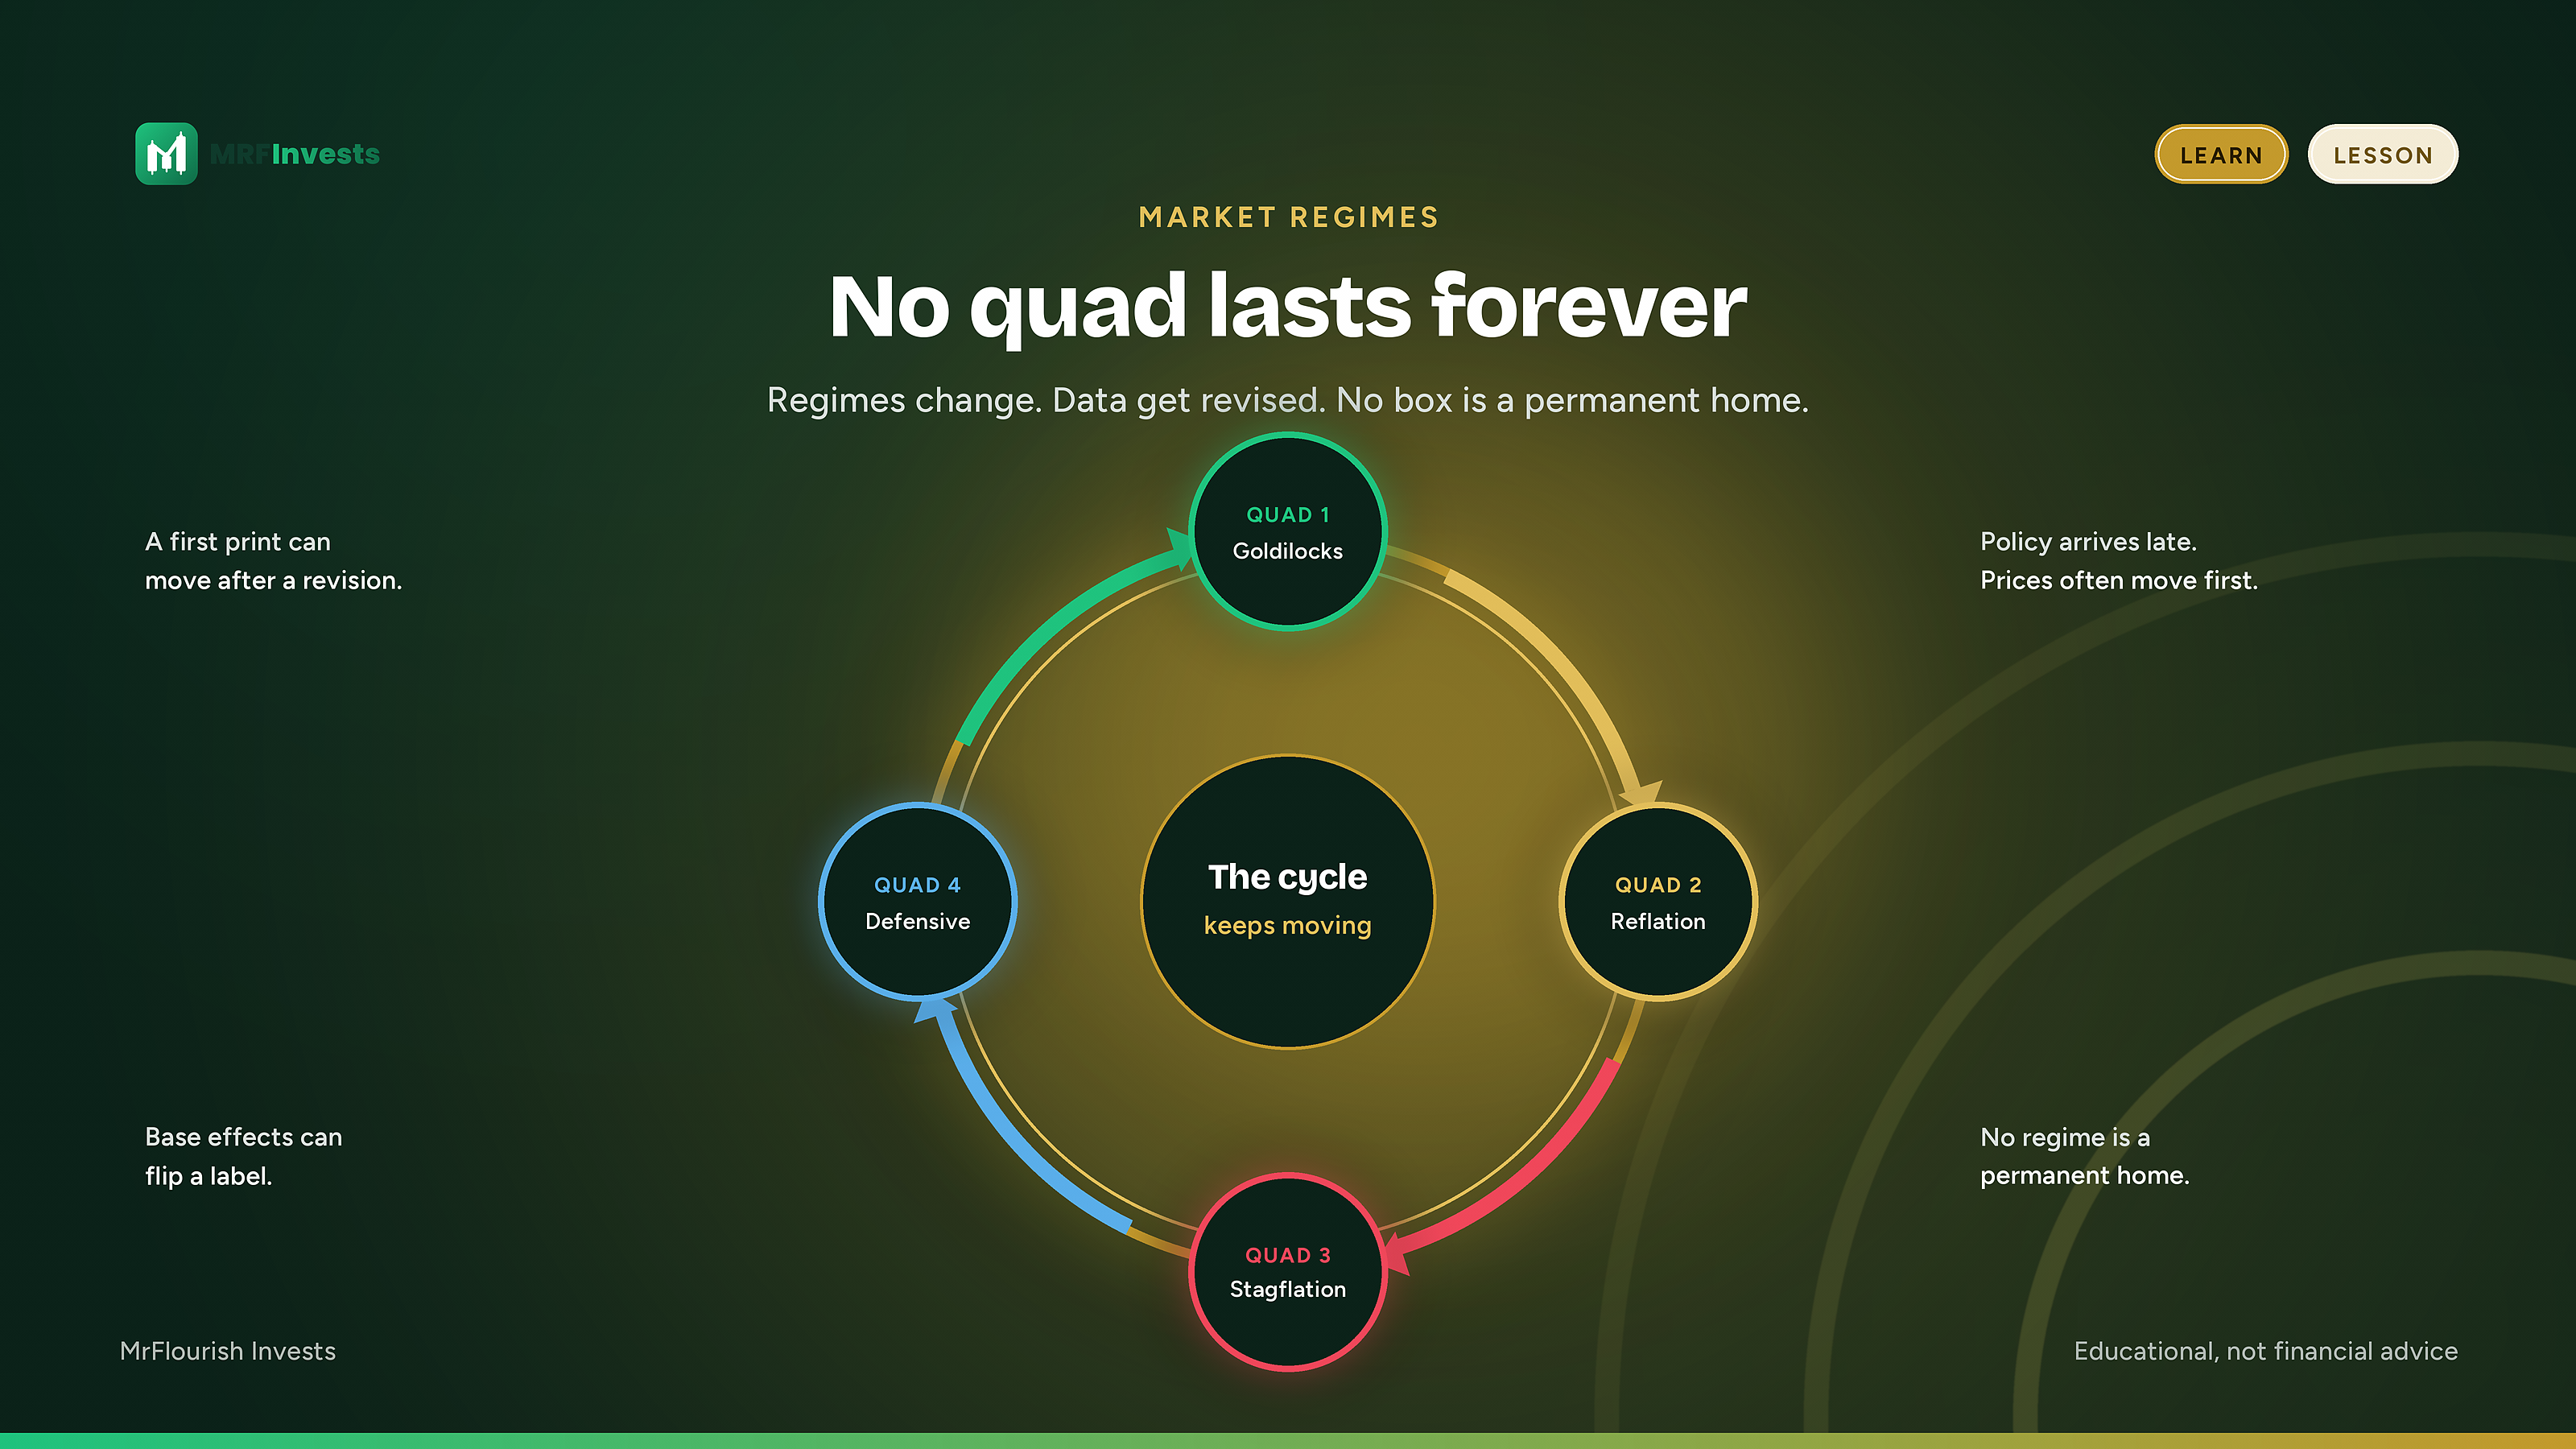
Regimes change. The label can change even when the world has not moved as much as the chart suggests.
Official data get revised. A growth or inflation reading that looked like an acceleration can be rewritten later as something flatter, or the reverse. Assign a quad from the first print and you can be in a different box after the revision.
Base effects also matter. Rate-of-change measures often compare today with a year ago. A comparison that was easy can become hard, or the other way around, simply because the year-ago number rolled off. The current month may not feel different, and the quad can still flip.
Policy is a response, and then it becomes a cause. Slowing growth and inflation have often brought easier policy. Accelerating growth and inflation have often brought tighter policy. Those responses can themselves push the economy toward a different quad. The map is not a closed loop that stays put once you label it.
Timeframe matters too. A monthly reading can sit in one quad while a quarterly reading sits in another. Think of the quarterly picture as the climate and the monthly picture as the weather. A milder month inside a tougher quarter is not a contradiction. It is one reason a short burst of strength or weakness can fade before a portfolio has been rebuilt around it.
Intensity matters as well. A shallow pass through a quad is not the same as a deep one.
Use the map. Do not marry the label.
Used carefully, the quads help you check whether your mix still fits the backdrop. If inflation is accelerating, ask whether you are carrying more long-duration risk than you meant to. If growth is slowing, ask whether your more cyclical tilts still belong in the size you gave them. That is risk management and a sector lens, not a trigger to trade every time a monthly figure prints.
On MrFlourish Invests, the Bucket Comparison is a practical place to look at sector leadership once you have a view of the backdrop. The guide How to Compare Sector Buckets explains how to line up those buckets. The Fear & Greed gauge answers a different question: it is a mood check, not a growth-and-inflation map. See How to Read the Fear and Greed Gauge for how to read it. Other tools live on the Tools page.
The limits are as important as the map. Different data series, seasonal adjustments, and lookbacks can put two careful people in two different quads on the same day. Monthly data is noisy. Revisions arrive late. A historical tendency is not a forecast, and a forecast is not a fill. Other forces, including positioning, policy surprises, and company-specific news, can dominate a stretch of tape even when the regime label is right.
This article also does not say which quad the economy is in now. Assigning that label depends on a specific data set, a specific method, and a date, and those calls belong to the people who maintain them. Hedgeye’s GIP process, including its monthly and quarterly maps, is one such method. Bridgewater’s All Weather work is a way to stay balanced across environments so that you do not have to be right about the next surprise. Neither one is a substitute for a written plan of your own.
If you use the quads at all, use them to pressure-test what you already hold. What would help? What would hurt? Does the size still fit? What an ATR Stop Is and How to Use It walks through setting a stop and a size from Average True Range. Then let the label change when the data change.
No quad lasts forever. The investors who stay standing are the ones who can change when the regime does. More lessons are on MrFlourish Invests Learn.
FAQ
What are the four economic quads?
The four economic quads are four market regimes you get by asking whether growth is accelerating or slowing and whether inflation is accelerating or slowing. Quad 1 has growth accelerating and inflation slowing. Quad 2 has both accelerating. Quad 3 has growth slowing and inflation accelerating. Quad 4 has both slowing.
Why do the quads use the rate of change instead of the level?
Markets usually react more to the direction of change than to the level. Inflation that is still high but slowing is a different environment from lower inflation that has just started to pick up, and prices often move at those turning points.
What has tended to do better in each quad?
In the past, long-duration growth and technology have tended to do better in Quad 1. Commodities and energy have tended to do better in Quad 2, and have held up better than growth-sensitive assets in Quad 3. Bonds, utilities and often the U.S. dollar have tended to do better in Quad 4. These are tendencies, not guarantees.
Who created the four-quad framework?
The version most investors know is the Growth, Inflation, Policy (GIP) model popularized by Hedgeye and its founder, Keith McCullough. Bridgewater’s All Weather work, associated with Ray Dalio, uses a related four-quadrant idea that measures growth and inflation against what markets expect.
Sources
- Hedgeye, Keith McCullough, Growth, Inflation, Policy (GIP) model and Quads, Education Center and “A Starter-Guide To #FullCycleInvesting” (September 4, 2019).
- Bridgewater Associates, Ray Dalio and colleagues, “The All Weather Story” (January 2012). Also available as a PDF.
- Tools and the sector-bucket guide, MrFlourish Invests, https://www.mrflourishinvests.com/tools/
Sunday Letter: tinyurl.com/mrfinvestsmail
Educational only. Not financial advice.
NFA. Everything on this site is for education and entertainment. It is not financial, investment, legal or tax advice.