Learn Articles
Article
What an ATR Stop Is and How to Use It
By Clark Kent for MrFlourish Invests
An ATR stop is a stop placed a set multiple of Average True Range away from your entry. Average True Range, or ATR, measures how much a price has been moving, including gaps, so the stop can sit outside ordinary noise instead of at a round number picked by eye.
This lesson is about the idea, not a click-by-click tour of a calculator. When you want help with the math, the ATR stop and position size tool and the free Risk Calculator on MrFlourish Invests will do it. The numbers below are labeled hypothetical examples, not live quotes.
What Average True Range measures
Volatility is the size of the moves, not the direction. Two stocks can both rise over a month and still move very differently day to day. A $1 stop under a quiet name might be plenty of room. The same $1 stop under a name that routinely swings $3 would get hit by ordinary movement.
J. Welles Wilder Jr. introduced Average True Range in 1978 in New Concepts in Technical Trading Systems. The “true” in True Range is the point: a day that opens far from the prior close has already moved before the session’s high and low are printed. High minus low alone would miss that gap.
True Range for a day is the largest of three distances:
- The day’s high minus the day’s low
- The absolute value of the day’s high minus the prior close
- The absolute value of the day’s low minus the prior close
ATR is an average of those True Range readings, most often over 14 days. Many platforms use Wilder’s smoothing, which starts with a simple 14-day average and then updates as: (prior ATR × 13 + today’s True Range) ÷ 14. Use the same averaging method you will use to set the stop. A shorter lookback reacts faster; a longer one is slower and smoother.
ATR is a dollar (or point) amount, not a direction and not a forecast. A 14-day ATR of $2.00 means that, on average over that stretch, the true range has been about $2. It does not tell you whether the next move is up or down.
How to calculate it, with a short example
The figures below are a labeled hypothetical, not a quote on any real name.
Suppose yesterday’s close was $50.00, and today the stock trades as high as $51.00 and as low as $49.20. The day’s high minus low is $1.80. The high versus the prior close is $1.00. The low versus the prior close is $0.80. True Range is the largest of those, $1.80.
Now change only one fact: today opens on a gap and the low is $47.50, with a high of $48.80. High minus low is $1.30. High versus the prior $50.00 close is $1.20. Low versus the prior close is $2.50. True Range is $2.50, because the gap down is part of the move.
You would repeat that for 14 days and average the results to get the first 14-day ATR. After that, Wilder’s smoothing updates the figure each day. You do not have to do this by hand. Charting platforms print ATR, and the ATR stop and position size tool on MrFlourish Invests lets you type the ATR you already have. It does not fetch prices.
Setting a stop at 1.5× to 3× ATR
A common way to place the stop is to multiply the 14-day ATR by 1.5, 2, or 3, then measure that distance from the entry.
- On a long, the stop sits that distance below the entry.
- On a short, the stop sits that distance above the entry.
The multiple is a judgment about how much room the trade needs. A 1.5× stop stays closer to the entry and will get hit more often, but the loss per share is smaller, so the position can be larger for the same dollar risk. A 3× stop is wider and less likely to be tagged by ordinary noise, so the position has to be smaller to keep the same dollar risk.
On MrFlourish Invests, the ATR stop and position size tool is built around a stop of about 1.5× the 14-day ATR, with a floor of 1× ATR. The floor is there so the stop does not sit inside a typical day’s range. A stop tighter than 1× ATR is often just a bet that this name will be quieter than it has been.
The 1.5× to 3× range is a teaching range, not a rule a market owes you. A quieter plan might live near 1.5× or 2×. A wider plan, or a name that regularly gaps, might need more. Match the multiple to the timeframe you are trading. A 14-day ATR on a daily chart is the wrong yardstick for a trade you mean to hold for an hour.
A labeled hypothetical: from ATR to a stop
These numbers are made up so the math is easy to follow. They are not a live quote.
- Hypothetical entry (long): $50.00
- Hypothetical 14-day ATR: $2.00
- Account size: $25,000
- Risk per trade: 1%, which is $250
Stop distances:
- 1× ATR floor: $2.00, so a long stop no tighter than $48.00
- 1.5× ATR: $3.00, stop at $47.00
- 2× ATR: $4.00, stop at $46.00
- 3× ATR: $6.00, stop at $44.00
If you choose 1.5×, you are planning to be out if the price reaches $47.00, which is $3.00 of risk per share. The 1× floor tells you not to pull that stop up to $48.50 just to make the size look larger.
A short flips the arithmetic. With the same $50.00 entry and a 1.5× ATR of $3.00, the stop would sit at $53.00.
Position sizing from the stop distance
Once the stop is set, size comes from the distance, not from a hunch. Divide the dollars you are willing to lose by the distance from entry to stop. That is the size that fits the risk.
In the hypothetical above, a 1.5× stop is $3.00 away. $250 divided by $3.00 is 83.33 shares, which rounds down to 83 shares. Actual risk is 83 × $3.00, or $249, just under the $250 cap. At the $50.00 entry, the position is worth $4,150.
The same $250 at a 2× stop ($4.00 away) is 62 shares. At 3× ($6.00 away) it is 41 shares. The wider stop does not mean you are risking more money. It means you hold less size so the dollar risk stays about the same.
To practice with your own numbers, use the free Risk Calculator on MrFlourish Invests. The guide How to Size a Trade From Your Stop walks through stocks and ETFs, crypto, and options with other labeled examples. This article will not list prices, stops, or targets from MFI alerts. If you follow an idea from the alerts on the homepage, you still size it for your own account. See From Weekly Trade Ideas to an MFI Alert for how those alerts relate to the weekly watchlist.
Trailing an ATR stop
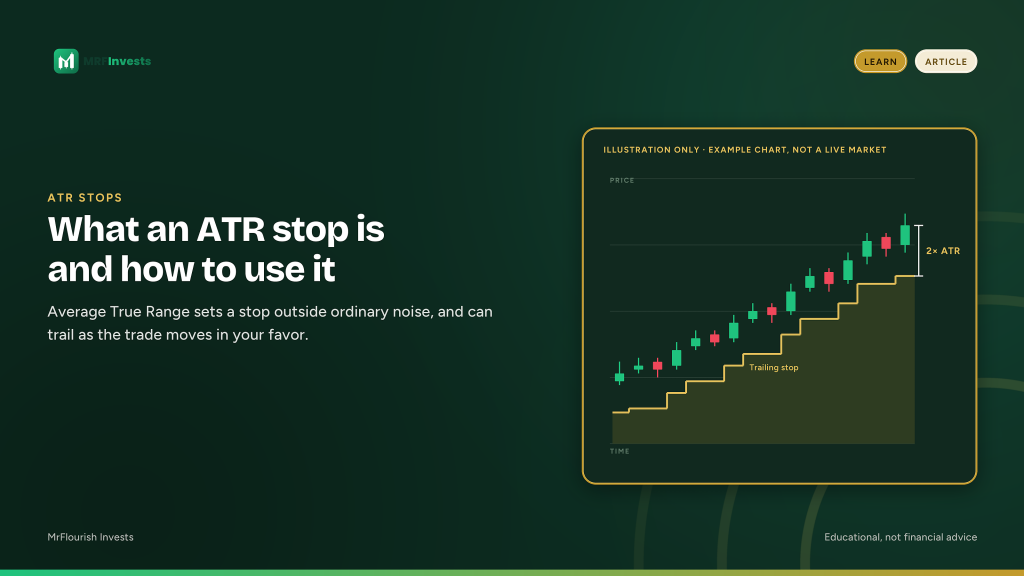
A trailing ATR stop moves only in the direction of the trade, and it uses a fresh ATR reading as the price changes.
Take the same hypothetical long at $50.00 with a 1.5× ATR stop at $47.00. If the price later trades at $54.00 and the 14-day ATR is still $2.00, 1.5× ATR is still $3.00, and the trail would sit at $51.00. You would not lower the stop back to $47.00 after that. The trail tightens the exit as the trade works, while still giving the position a volatility-based cushion.
ATR itself can change. If the name becomes more active and the 14-day ATR rises from $2.00 to $2.60, 1.5× is $3.90. From a $54.00 price, that trail would sit at $50.10. If ATR shrinks, the trail can come closer. Recalculate from the current ATR rather than freezing the first dollar distance forever.
Traders differ on how often to update the trail — every day, after a close, or only after a new swing high. Pick a rule before you enter, and write it down. A trailing stop is a plan for where you are out, not a promise of a fill at that price.
Common mistakes
- Setting the stop inside 1× ATR. If a typical true range is $2.00, a $1.00 stop is inside the noise and will get hit often for reasons that have nothing to do with the thesis.
- Using one multiple on every name. A quiet fund and a high-volatility stock do not deserve the same dollar stop, which is why you start from ATR in the first place.
- Mixing timeframes. A 14-day ATR on the daily chart does not size an intraday stop. Use the ATR that matches the chart you are trading.
- Treating ATR as a prediction. ATR describes how large recent ranges have been. It does not say the next range will be the same size, or which way it will go.
- Ignoring gaps. True Range exists because prices jump. A stop is an order, not a guarantee. Size and plan as if the fill can be worse than the stop you wrote.
- Moving the stop farther away after the trade goes against you. That turns a planned loss into a larger one. A trail should only tighten in the direction of the trade.
- Changing size after the fact instead of when you set the stop. If you widen the stop, you have to reduce the size to keep the same dollar risk.
- Copying someone else’s stop distance onto your account. A stop that fits one account may be too much risk for another. MFI alerts are the posted portfolio moves, not a substitute for your own size math, and this article will not reprint their prices.
Putting the tools to work
On MrFlourish Invests, two tools sit next to this lesson:
- The ATR stop and position size tool, a PRO calculator on the Tools page, takes the ATR you type and helps you set a stop at about 1.5× the 14-day ATR, stay outside the 1× floor, and size the trade from that stop. It does not fetch prices.
- The free Risk Calculator will size a stock, ETF, crypto, or options trade once you already have an entry and a stop.
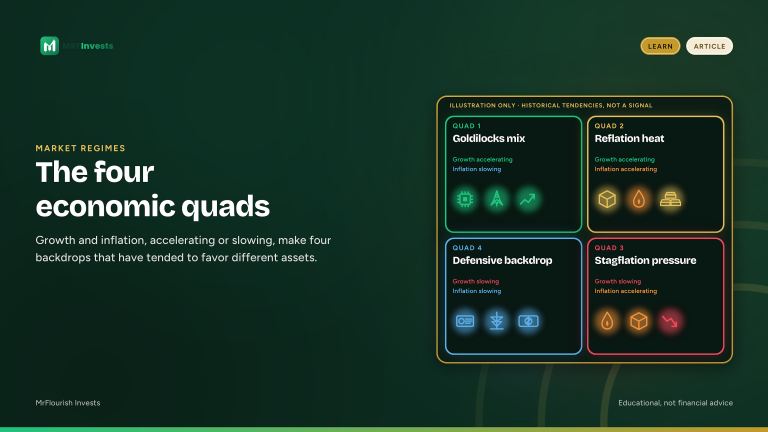
The lesson does not change if you do the arithmetic by hand. Pick the ATR and the multiple, place the stop outside ordinary noise, size from the distance, and write down how you will trail it. Check the backdrop with The Four Economic Quads. More lessons are on MrFlourish Invests Learn.
FAQ
What is an ATR stop?
An ATR stop is a stop-loss placed a set multiple of Average True Range (ATR) away from the entry. Because ATR measures how much a price has been moving, including gaps, the stop can sit outside ordinary noise instead of at a number picked by eye.
How is Average True Range calculated?
True Range is the largest of three distances: the day’s high minus low, the high minus the prior close, and the low minus the prior close (both as absolute values). ATR is the average of True Range, usually over 14 days. Many platforms use Wilder’s smoothing, introduced by J. Welles Wilder Jr. in 1978.
How far away is an ATR stop usually placed?
A common teaching range is 1.5 to 3 times the 14-day ATR, measured below the entry on a long and above it on a short. A floor of 1× ATR keeps the stop outside a typical day’s range. Wider multiples get hit less often but call for a smaller position.
How do you size a position from an ATR stop?
Divide the dollar amount you are willing to lose by the distance from entry to stop. A wider stop means fewer shares, so the dollar risk stays about the same. A trailing ATR stop moves only in the trade’s direction, using the current ATR.
Sources
- J. Welles Wilder Jr., New Concepts in Technical Trading Systems (Trend Research, 1978), which introduced Average True Range, True Range, and Wilder’s smoothing.
- ATR stop and position size tool and Risk Calculator, MrFlourish Invests, https://www.mrflourishinvests.com/tools/
- How to Size a Trade From Your Stop, MrFlourish Invests, https://www.mrflourishinvests.com/2026/11/17/how-to-size-a-trade-from-your-stop/
Sunday Letter: tinyurl.com/mrfinvestsmail
Educational only. Not financial advice.
NFA. Everything on this site is for education and entertainment. It is not financial, investment, legal or tax advice.