
MrFlourish Invests (in BETA)
Free market tools for active investors (in BETA)
Read the market’s mood, follow every alert, and size every trade before you place it. Green FREE tools are open to everyone, no sign-in. Teal tools come free with our newsletters. Gold PRO tools unlock with a PRO membership.
Explore the Market Free
Check the market’s mood, SPY levels, which sectors lead and the newest alerts before you plan a trade.
Free Trade Ideas, delivered to your inbox Free with newsletter
Sign up free and get ideas and the week’s big picture by email.
Free Calculators Free
Size every trade from your stop, and see what steady investing adds up to.
PRO tools
Built on the same process behind the alerts: stops, size, options payoff, levels and a written plan. No live market data needed. Membership is in BETA.
$69.99 a month
MrFlourish Invests (in BETA)
Ledger & Weekly Ideas PRO
The record behind every alert, and every setup MrFlourish is watching each week.
Risk Management PRO
Know where you are out and how big to go before you buy.
Options PRO
See the payoff before you open the position.
Technical PRO
Mark the levels before the week starts.
Planning PRO
Write the plan first, then take the trade.
Free tools
These tools are open to everyone. The calculators do not fetch live prices. Fear & Greed and the Bucket Comparison use market data, and the gamma map is updated by hand.
Free Risk Calculator · Free Calculators Back to all tools ↑
Free Compounding calculator · Free Calculators Back to all tools ↑
Free tool
See what patience is worth
Move the sliders to see how steady investing adds up over time.
You could have$0
- You put in
- $0
- Growth from compounding
- $0
Total valueMoney you put in
A hypothetical illustration that assumes a steady return compounded monthly. Real returns vary year to year and can be negative.
Free Fear & Greed gauge · Explore the Market Back to all tools ↑
MRF Fear & Greed Gauge
✦ As of Nov 18, 2026 · 1:22 PM CT ✦Investors are very fearful right now. Historically, Extreme Fear has often been a contrarian buy zone, though readings can stay low for weeks.
- Previous close 25 Fear
- 1 week ago 36 Fear
- 1 month ago 18 Extreme Fear
- 1 year ago 9 Extreme Fear
What is the Fear & Greed Index?
The CNN Business Fear & Greed Index is a 0 to 100 gauge of the stock market’s mood. It blends seven market signals, weighted equally. Below 25 is Extreme Fear, 25 to 44 is Fear, 45 to 55 is Neutral, 56 to 75 is Greed and above 75 is Extreme Greed.
The seven signals
- Market momentum: the S&P 500 compared with its 125-day moving average.
- Stock price strength: stocks hitting 52-week highs versus 52-week lows on the NYSE.
- Stock price breadth: trading volume in rising stocks versus falling stocks.
- Put and call options: the 5-day put/call ratio. Buying more puts than usual is a sign of fear.
- Market volatility (VIX): the VIX compared with its 50-day average. A rising VIX is a sign of fear.
- Safe haven demand: stock returns versus Treasury bond returns over the last 20 trading days.
- Junk bond demand: the extra yield on junk bonds over investment-grade bonds. A wider gap is a sign of fear.
How investors use it. It is a mood check, not a timing tool. Extreme Fear has historically lined up with contrarian buying opportunities, and Extreme Greed with times to be careful. The gauge can stay at an extreme for weeks, so it works best next to your own plan, not instead of it.
Source: CNN Business Fear & Greed Index
MrFlourishInvests.com NFA
Free SPY 0DTE Gamma Map · Explore the Market Back to all tools ↑
MRF SPY 0DTE Gamma map
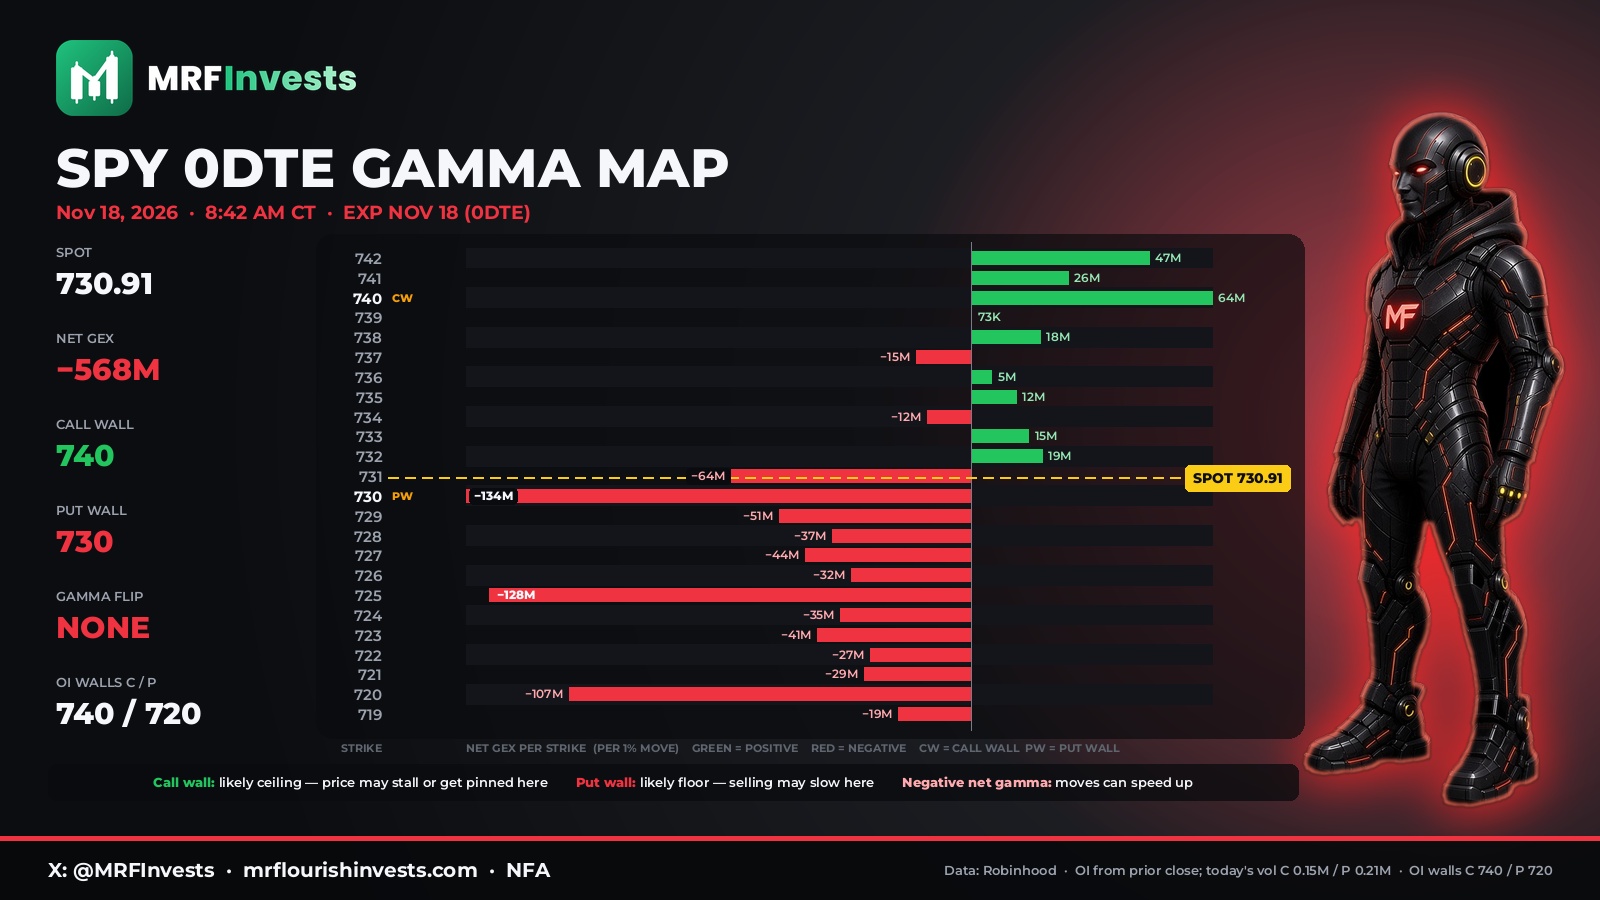 ✦ Hourly Updates for Subscribers in Tools ✦
Gamma map for SPY 0DTE 📊
11/18/26 · 8:42 AM CT
- Spot: 730.91
- Net Gamma: −0.57B per 1% move
- Call Wall: 740
- Put Wall: 730
- Flip: NONE
- Put Cluster: 730 (about −208M on the put side)
SITE 🌐 Mrflourishinvests.com (in BETA)
NFA
Free Bucket Comparison · Explore the Market · free during BETA Back to all tools ↑
MRF Bucket Comparison
BETAFreePick any two of MrFlourish’s sector buckets and see who is winning the money flow: bucket averages, movers, the spread, and how each stacks up against the index futures.
Loading live quotes…
Saved comparisons
Saves keep the bucket pair only and re-run live when loaded. Saved in this browser.
NFA. Not financial advice. Equal-weight bucket averages for education, not alerts.
PRO tools
PRO tools unlock with a PRO membership. Until then you see a locked preview. The other seven PRO tools are coming soon.
PRO ATR stop and position size · Risk Management Back to all tools ↑
PRO (in BETA)
ATR stop and position size
Set a stop at about 1.5× the 14-day ATR, stay outside the 1× ATR floor, and size the trade from that stop. You type the ATR — this tool does not fetch prices.
This is a PRO tool
Unlock the ATR stop and position size calculator with a PRO membership. $69.99 a month. MrFlourish Invests (in BETA).
Become a PRONFA
Educational only. Not financial advice. These tools are illustrations. They exclude commissions, slippage, and gaps. Real returns vary and can be negative. No auto-trading. MrFlourish Invests (in BETA).