
Learn Tool Guides
Tool guide
How to Read the Fear & Greed Gauge
By MrFlourish · MrFlourish Invests (in BETA)
November 17, 2026
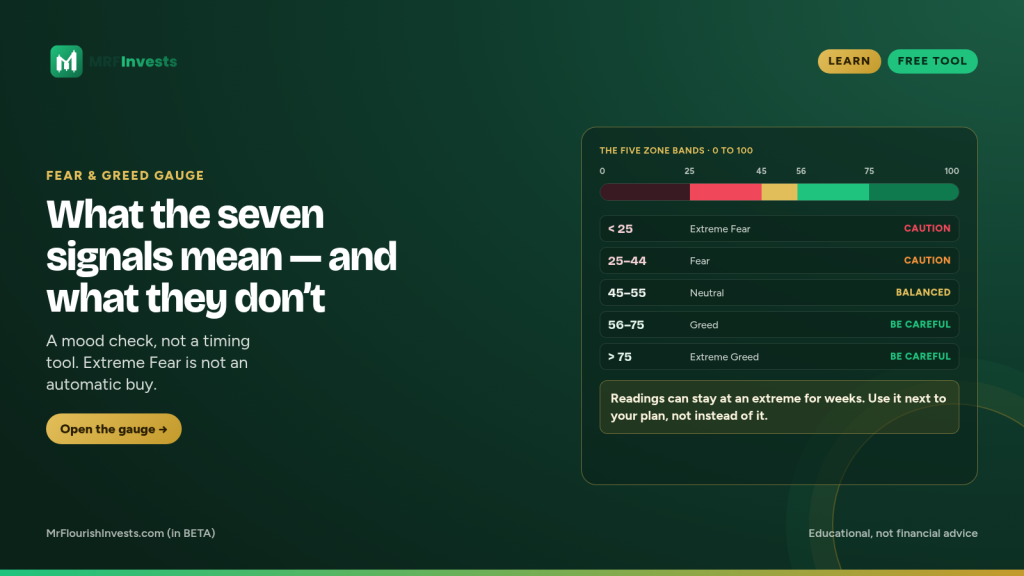
The Fear & Greed Gauge on MrFlourish Invests (in BETA) is a 0 to 100 read on the stock market’s mood. It is a mood check, not a timing tool. A low reading does not mean “buy now,” and a high reading does not mean “sell now.”
The gauge presents the CNN Business Fear & Greed Index, which blends seven market signals, each weighted equally. This lesson walks through those signals, the zone bands, and the most common mistake: treating Extreme Fear as an automatic buy.
The five zone bands
The scale runs from 0 to 100. The bands on the gauge are:
- Below 25: Extreme Fear
- 25 to 44: Fear
- 45 to 55: Neutral
- 56 to 75: Greed
- Above 75: Extreme Greed
A move from one band to the next is a change in mood, not a trade signal by itself. The gauge also shows recent context, such as the prior close and readings from a week, a month, and a year earlier, so you can see whether the mood has shifted or simply stayed in the same neighborhood.
The seven signals
Each signal is one slice of market behavior. Together they produce the single 0 to 100 number. None of them is a crystal ball on its own.
Market momentum. The S&P 500 is compared with its 125-day moving average. When the index sits well above that average, momentum leans toward greed. When it sits well below, momentum leans toward fear.
Stock price strength. This counts stocks hitting 52-week highs versus 52-week lows on the NYSE. More new highs than new lows is a sign of strength. A rush of new lows is a sign of fear.
Stock price breadth. This looks at trading volume in rising stocks versus falling stocks. When more of the volume is in declining names, breadth is weak, and the signal leans toward fear.
Put and call options. This uses the 5-day put/call ratio. Puts are often used as protection, or as a bet that prices will fall. Buying more puts than usual is a sign of fear. Buying more calls than usual leans toward greed.
Market volatility (VIX). The VIX is compared with its 50-day average. A rising VIX is a sign of fear. A quiet, falling VIX leans the other way. The VIX is a read on expected swings in the S&P 500, not a price forecast.
Safe-haven demand. This compares stock returns with Treasury bond returns over the last 20 trading days. When investors prefer the relative safety of Treasuries, the signal leans toward fear. When they prefer stocks, it leans toward greed.
Junk bond demand. This looks at the extra yield on junk bonds over investment-grade bonds. A wider gap means investors are demanding more pay to hold riskier credit, which is a sign of fear. A narrower gap is a sign of appetite for risk.
Why Extreme Fear is not an automatic buy
Extreme Fear has often lined up with moments when selling was exhausted and longer-term buyers later did well. That history is why people call it a contrarian zone. It is not a green light.
The gauge can stay at an extreme for weeks. A reading in the teens, to take a labeled example, can be followed by another week in the teens. The mood can be fearful while prices are still falling, and it can turn up without telling you which day the turn arrives.
The index describes the market’s mood, not the plan for a single name. A fearful tape does not keep one stock from making a new low. Extreme Greed works the same way in the other direction: it has often been a time to be careful, not an automatic sell signal.
Use the gauge next to your own plan. That can include a watchlist, a position size you can live with, and a stop you have already chosen. The Risk Calculator is one way to set that size before you act on a mood reading. If you follow MFI alerts, the levels stay on the member side of the site. This lesson will not list them.
How to use the gauge
- Read the number, then read the band: Extreme Fear, Fear, Neutral, Greed, or Extreme Greed.
- Check the recent history on the tool so you can see whether the mood just changed or has been stuck.
- If you want the “why,” open the seven signals and see which ones are pulling the reading.
- Do not let a single extreme reading override a stop, a risk limit, or a decision to stand aside.
The most useful question is not “is this a buy?” It is “does this mood match the risk I am about to take, and do I still have a plan if I am wrong?”
Sunday Letter: tinyurl.com/mrfinvestsmail
Educational only. Not financial advice.
NFA. Everything on this site is for education and entertainment. It is not financial, investment, legal or tax advice.
Related guides
Tool guide
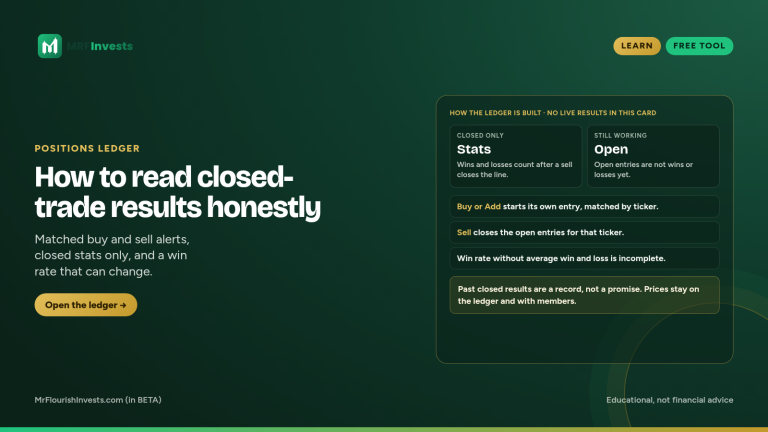
How to Read the Positions Ledger
Learn how to read the Positions Ledger's public closed-trade stats — win rate, average win versus average loss, and average return — and what stays with PRO members.
Read guide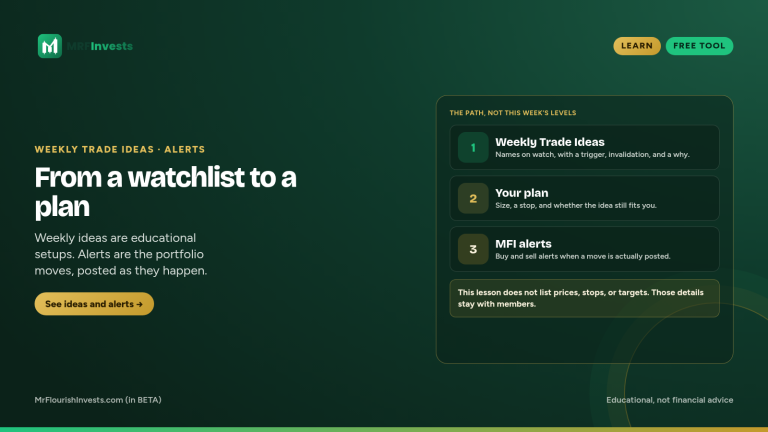
Tool guide
From Weekly Trade Ideas to an MFI Alert
See how Weekly Trade Ideas work as a watchlist and how MFI alerts are the posted portfolio moves, without listing prices, stops, or targets.
Read guide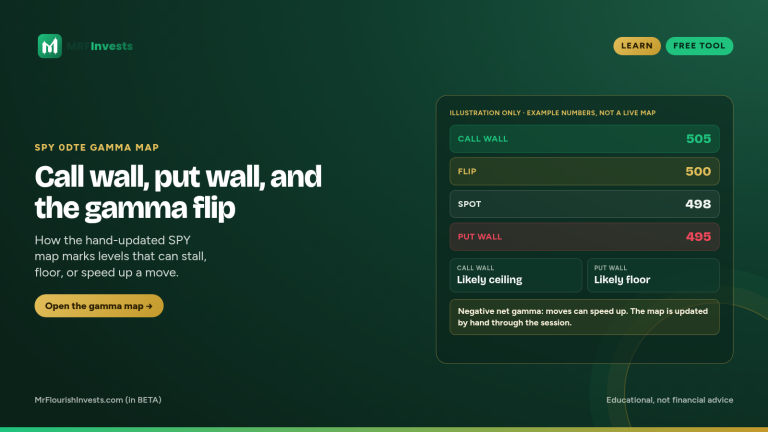
Tool guide
How to Read the SPY 0DTE Gamma Map
Learn how to read the call wall, put wall, and gamma flip on the free SPY 0DTE Gamma Map, which is updated by hand through the session.
Read guide