
Learn Tool Guides
Tool guide
How to Read the Positions Ledger
By MrFlourish · MrFlourish Invests (in BETA)
November 17, 2026
The Positions Ledger on MrFlourish Invests (in BETA) is the running record of every position from MrFlourish’s buy and sell alerts, matched by ticker. The methodology and the headline closed-trade stats are public. The live P/L of open positions, the full positions table, and the watch list are for PRO members (in BETA). This lesson is about how to read that record honestly: what the public figures can teach you, what stays with PRO, and why a win rate without context can mislead you.
Those public stats change as new alerts close. This article will not reprint prices, stops, or targets from the alerts. You can open the Positions Ledger for the live figures, and the alerts page for the public alert record.
How a line gets on the ledger
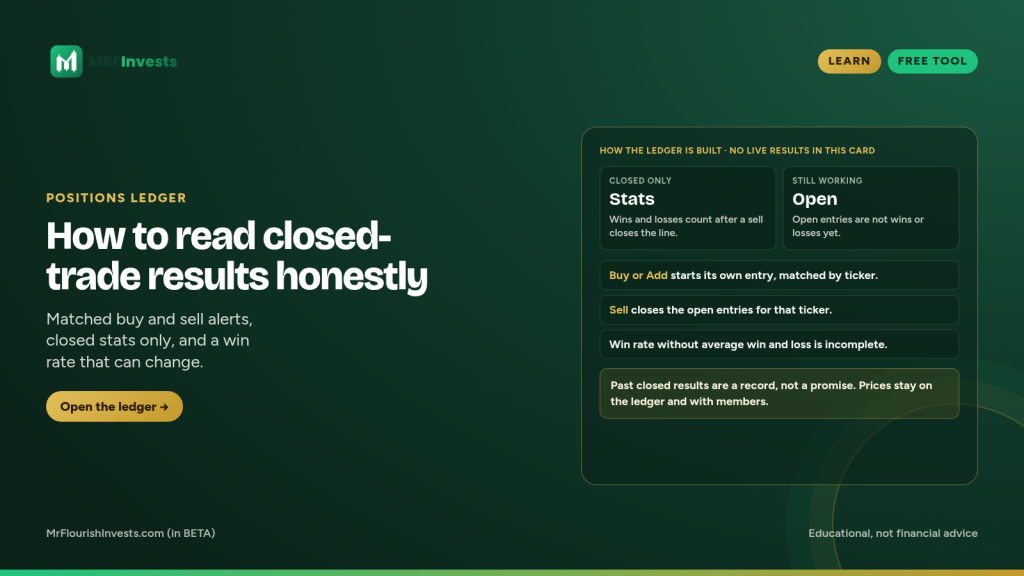
Each Buy or Add alert becomes its own entry, matched by ticker. If the same name is bought, then added to later, those are separate lines, not one blended row that hides the adds. A Sell alert closes the open entries for that ticker at the sell alert’s price.
Every alert is timestamped the moment it is posted. The running timestamp methodology means members can see when an entry and an exit happened, not just the prices on the tickets. Some rows are ordinary stock lines. Others are options or multi-leg pair trades with their own rounds. The same idea still holds: an open leg is open until it is closed.
Closed stats only
The headline figures — closed positions, wins, losses, win rate, average win, average loss, and average return per closed position — are on the public page. They count closed positions only, using the prices posted on the alerts. The page also shows how many positions are still open. Those open names are not wins yet, and they are not losses yet.
That is the first honest read. A high win rate next to a large open book is an unfinished story. The open book can still change the record. The closed list is the only part the percentages are allowed to describe.
How to read a win rate without fooling yourself
Win rate is the share of closed entries that finished ahead. It does not tell you how large the wins were, how large the losses were, or how long money was at risk. A book of many small wins and one large loss can show a handsome win rate and still be a poor result. That is why the ledger also shows average win, average loss, and average return per closed position. Read those together.
Average win is the typical size of the closed trades that finished ahead. Average loss is the typical size of the ones that finished behind. Average return per closed position blends both into one figure for the closed book. The relationship between the two averages is the useful part. If the average loss is much smaller than the average win, a high win rate is being supported by losses that were kept short — one bad trade is less likely to erase a string of wins. If the average loss is larger than the average win, you need a very high win rate just to break even. At the time of writing (November 18, 2026), the public stats showed a closed book whose average loss was a good deal smaller than its average win. Those numbers will change as more trades close, so read the live figures on the ledger, not the ones in this sentence.
A few more habits keep the reading honest:
- Do not promote an open trade into a win because it looks good today. Marked-to-market is not a close. Live P/L on open positions is for PRO members, and even then it is a snapshot, not a result.
- Quotes on that live P/L table are delayed, via Yahoo Finance, and can include extended hours. They are not real-time.
- Remember that adds are separate entries. Closing a ticker can close more than one line at the sell-alert price.
- The prices in the stats are the prices posted on the alerts, not your fill, and they exclude the way a gap or slippage might have treated a live order.
- Past closed results are a record of one process, not a promise that the next alert will look the same.
What is public and what is PRO
Anyone can learn from the methodology and the headline stats. The full open and closed positions — ticker, entry, exit, status, and P/L — the live P/L of open positions, and the “What we’re watching” list are for PRO members (in BETA). Those sections sit behind placeholders on the public ledger. You can review them there if you have access, or start at PROs.
Using the ledger next to a plan
The ledger is a scoreboard and a history, not a signal to copy the last line at the last price. If a ticker on the ledger is also in an article or in an alert, the live details stay on those pages and with members. This lesson will not list them.
If you are deciding whether a new idea fits your own account, go back to size and a stop. The Risk Calculator is built for that. The public stats tell you how closed alerts have resolved in the aggregate. They do not size the next trade for you.
Sunday Letter: tinyurl.com/mrfinvestsmail
Educational only. Not financial advice.
NFA. Everything on this site is for education and entertainment. It is not financial, investment, legal or tax advice.
Related guides
Tool guide
How to Read the SPY 0DTE Gamma Map
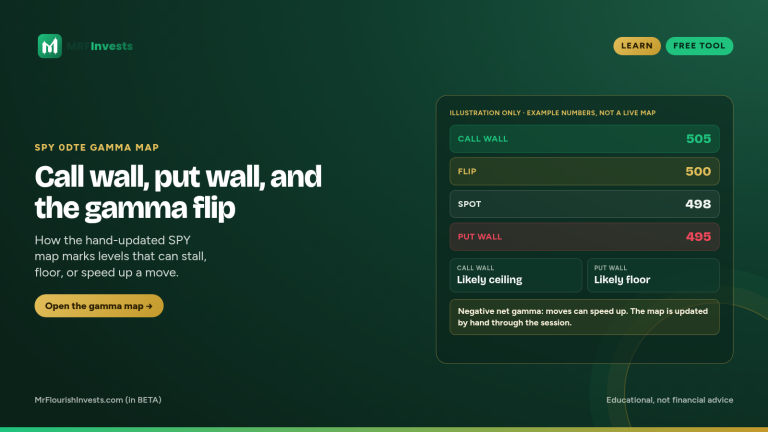
Learn how to read the call wall, put wall, and gamma flip on the free SPY 0DTE Gamma Map, which is updated by hand through the session.
Read guide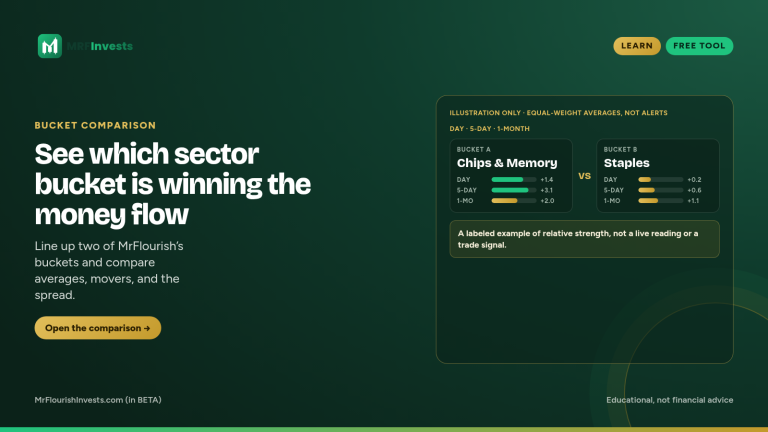
Tool guide
How to Compare Sector Buckets
Line up two of MrFlourish’s sector buckets and compare averages, movers, and the spread to see where money is moving.
Read guide
Tool guide
From Weekly Trade Ideas to an MFI Alert
See how Weekly Trade Ideas work as a watchlist and how MFI alerts are the posted portfolio moves, without listing prices, stops, or targets.
Read guide