
Learn Tool Guides
Tool guide
How to Compare Sector Buckets
By MrFlourish · MrFlourish Invests (in BETA)
November 17, 2026
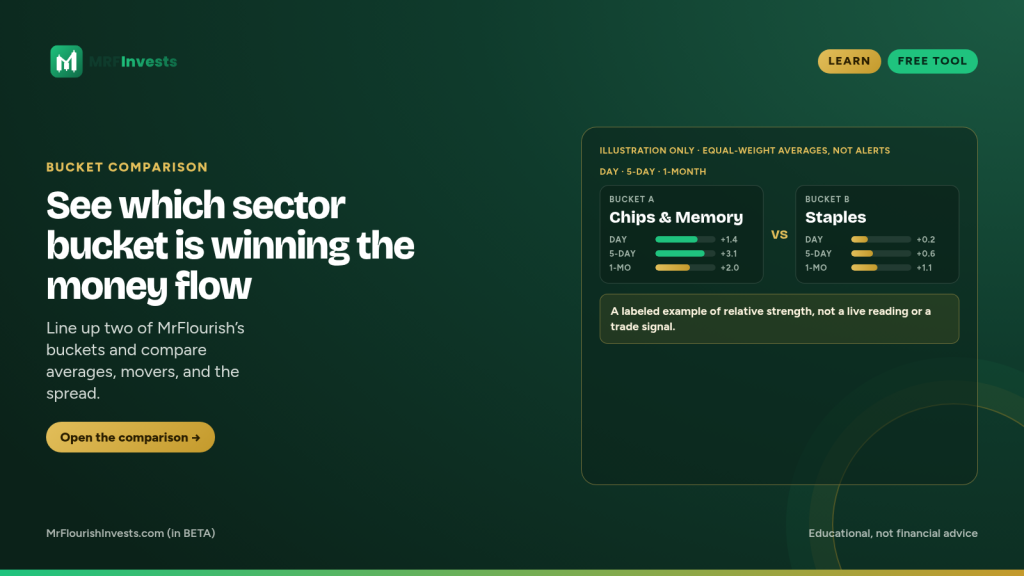
The Bucket Comparison on MrFlourish Invests (in BETA) lets you line up two of MrFlourish’s sector buckets and see which one is winning the money flow. It is a relative-strength tool: bucket averages, movers, the spread between them, and how each bucket stacks up against index futures.
This is a paid member tool, open as a free preview while the site is in BETA. Equal-weight bucket averages are for education, not alerts. The figures on the screen are live when you open it, so this lesson will not freeze today’s readings into the article. The examples below are labeled illustrations of how to read the layout.
What a bucket is
A bucket is a group of names MrFlourish watches in one theme: Chips & Memory, Tech, Healthcare, Financials, Crypto, Energy, Consumer Staples, Materials, and Industrials. The count next to each name is how many tickers sit in that bucket. The average is equal-weight, so one large stock does not quietly become the whole bucket.
You pick Bucket A and Bucket B, then compare them. The tool will ask you to pick two different buckets. A saved comparison stores the pair only, in this browser, and runs again live when you load it. It does not store old prices as if they were still current.
Day, 5-day, and 1-month
Each comparison can be read on three windows: the day, five days, and one month. A bucket can lead on the day and lag on the month, or the other way around. That is often the first useful question: is the lead just today’s noise, or has money been rotating for weeks?
The side-by-side view shows each bucket’s equal-weight average in those windows. The spread is the difference between the two averages: who is ahead, and by how much. The tool also compares each bucket with index futures (bucket percent minus futures percent), so you can see whether a sector is leading or lagging the index, not only beating the other bucket.
Movers are the names doing the work inside a bucket. A strong average can be broad, or it can be one or two stocks carrying the group. If the average looks strong and the movers are narrow, the leadership is thinner than the headline number.
A labeled way to read a comparison
Imagine, as an example only, that you line up Chips & Memory against Consumer Staples. Over five days the chips bucket is ahead, the spread is positive, and chips are also ahead of the index futures. Staples are flatter. That would be a picture of cyclical or growth leadership versus a defensive group. It would not, by itself, be a reason to buy one name or sell another.
Swap the windows. If the one-month view still favors chips, the rotation has more history behind it. If only the day looks strong, you may be looking at a bounce. The tool will show you the numbers when you open it. Do not treat the illustration in this paragraph as a live reading.
What it is not
It is not an alert, and it is not a ranked list of buys. Equal-weight averages smooth the bucket; they also hide position size and the plan behind any one ticker. If you follow an MFI alert, this lesson will not list prices, stops, or targets. Those details stay with members.
Use the comparison to see where money has been moving, then go back to a plan you can size and invalidate. The Risk Calculator is the place to turn a name you are considering into a position size from a stop.
Sunday Letter: tinyurl.com/mrfinvestsmail
Educational only. Not financial advice.
NFA. Everything on this site is for education and entertainment. It is not financial, investment, legal or tax advice.
Related guides
Tool guide
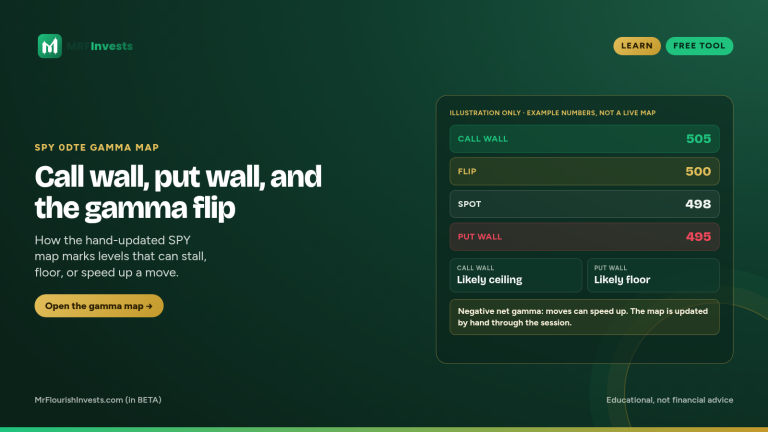
How to Read the SPY 0DTE Gamma Map
Learn how to read the call wall, put wall, and gamma flip on the free SPY 0DTE Gamma Map, which is updated by hand through the session.
Read guide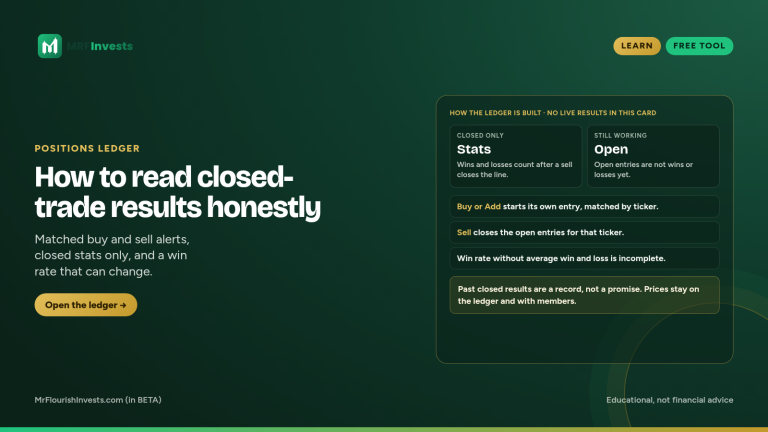
Tool guide
How to Read the Positions Ledger
Learn how to read the Positions Ledger's public closed-trade stats — win rate, average win versus average loss, and average return — and what stays with PRO members.
Read guide
Tool guide
From Weekly Trade Ideas to an MFI Alert
See how Weekly Trade Ideas work as a watchlist and how MFI alerts are the posted portfolio moves, without listing prices, stops, or targets.
Read guide