
Learn Tool Guides
Tool guide
How to Read the SPY 0DTE Gamma Map
By MrFlourish · MrFlourish Invests (in BETA)
November 17, 2026
The SPY 0DTE Gamma Map on MrFlourish Invests (in BETA) is a hand-updated picture of where same-day option activity in SPY is clustered. It is a map of levels, not a trade signal. This lesson explains the call wall, the put wall, the gamma flip, and what a negative net-gamma reading is telling you.
The figures on the live map change through the session. They are entered by hand, and subscribers get hourly updates in Tools. Nothing below is today’s map. The numbers in this lesson are labeled examples, so you can learn the vocabulary without treating a snapshot as a live quote.
What “0DTE” and gamma are doing here
0DTE means the options expire the same day. SPY has a large same-day options market, and dealers who sell those options often hedge as the index moves. That hedging can slow a move near a large strike, or speed one up, depending on whether net gamma is positive or negative.
You do not need a dealer model to use the map. You need to know which levels are marked and what each label is meant to suggest. The map does not place an order, and it does not say that SPY will stop or reverse at a line.
How to read the labels
The tool’s own key is short, and it is the right place to start:
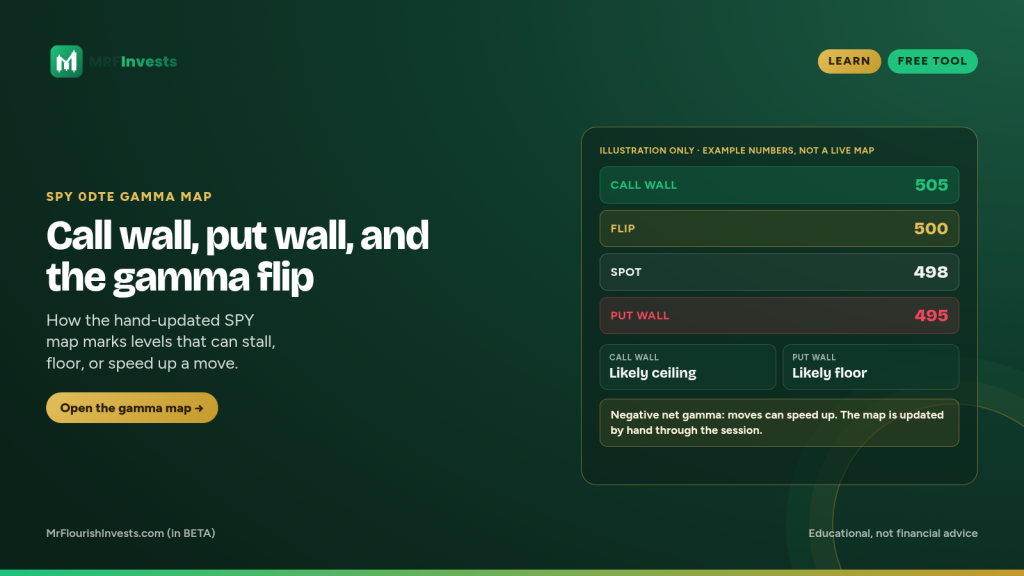
- Call wall: a likely ceiling. Price may stall or get pinned here.
- Put wall: a likely floor. Selling may slow here.
- Negative net gamma: moves can speed up.
The map also shows spot, the SPY price at the time of that hand update; net gamma, expressed as a figure per 1% move; a flip level when one is marked; and, at times, a put cluster, a nearby pocket of put activity.
The gamma flip is the level where net gamma is treated as changing sign. Above a flip, dealer hedging often leans toward damping moves. Below it, hedging can lean toward amplifying them. If the map shows “NONE,” a flip is not marked in that update. That is information too: do not invent a flip that the map is not showing.
A labeled example, not a live map
Suppose, in this made-up snapshot, SPY spot is 498, the call wall is 505, the put wall is 495, and the flip is 500. Net gamma is negative. In that picture, 505 is the ceiling to watch, 495 is the floor, and the index is already under the flip, so the map would be warning that moves can speed up rather than get pinned.
Change any one of those inputs and the story changes. A put wall just under spot is a different setup from a put wall far below it. A flip marked “NONE” is a different setup from a flip sitting on top of spot. Always read the time stamp on the map. A hand-updated tool is only as current as its last entry.
How to use it next to a plan
Treat the walls and the flip as context, the way you might glance at a round number or a moving average: useful, not sufficient. If you are sizing a trade in SPY or a name that tracks it, the Risk Calculator still sets size from your stop and the dollars you are willing to risk. The gamma map does not replace a stop.
If you follow a weekly idea or an MFI alert, this lesson will not list prices, stops, or targets. Those details stay with members. Use the map to see where same-day SPY activity is stacked, then go back to your own plan.
Sunday Letter: tinyurl.com/mrfinvestsmail
Educational only. Not financial advice.
NFA. Everything on this site is for education and entertainment. It is not financial, investment, legal or tax advice.
Related guides
Tool guide
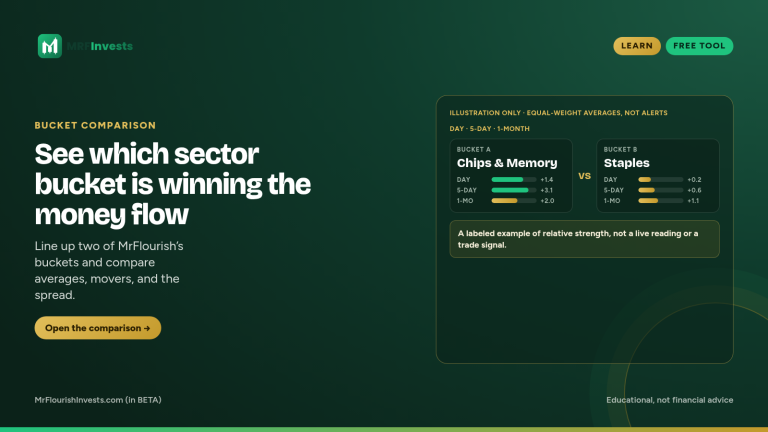
How to Compare Sector Buckets
Line up two of MrFlourish’s sector buckets and compare averages, movers, and the spread to see where money is moving.
Read guide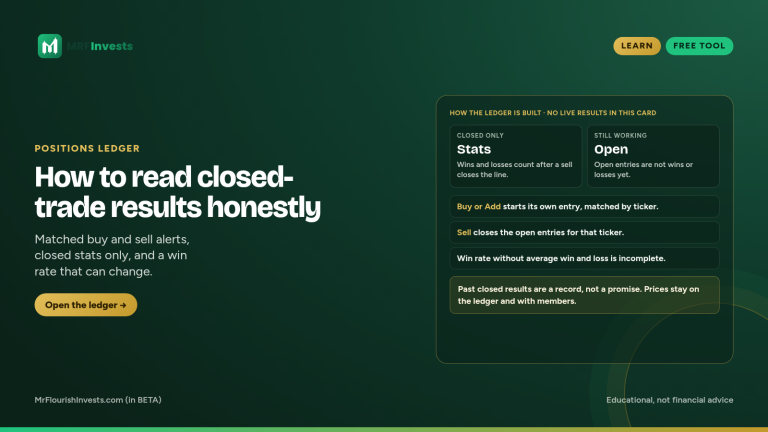
Tool guide
How to Read the Positions Ledger
Learn how to read the Positions Ledger's public closed-trade stats — win rate, average win versus average loss, and average return — and what stays with PRO members.
Read guide
Tool guide
From Weekly Trade Ideas to an MFI Alert
See how Weekly Trade Ideas work as a watchlist and how MFI alerts are the posted portfolio moves, without listing prices, stops, or targets.
Read guide