
Learn Tool Guides
Tool guide
How to Size a Trade From Your Stop
By MrFlourish · MrFlourish Invests (in BETA)
November 17, 2026
The size of a trade should come from the stop, not from a hunch. If you know how many dollars you are willing to lose if the stop is hit, the position size is a short piece of math. The free Risk Calculator on MrFlourish Invests (in BETA) does that math for stocks and ETFs, crypto, and options.
This is a teaching example. The numbers below are made up and clearly labeled so you can follow the steps. The calculator does not fetch live prices. You type the entry, the stop, and, if you use one, the target.
The simple rule
Pick the dollars you will risk. Measure the distance from your entry to your stop. Divide the first number by the second. That is the size.
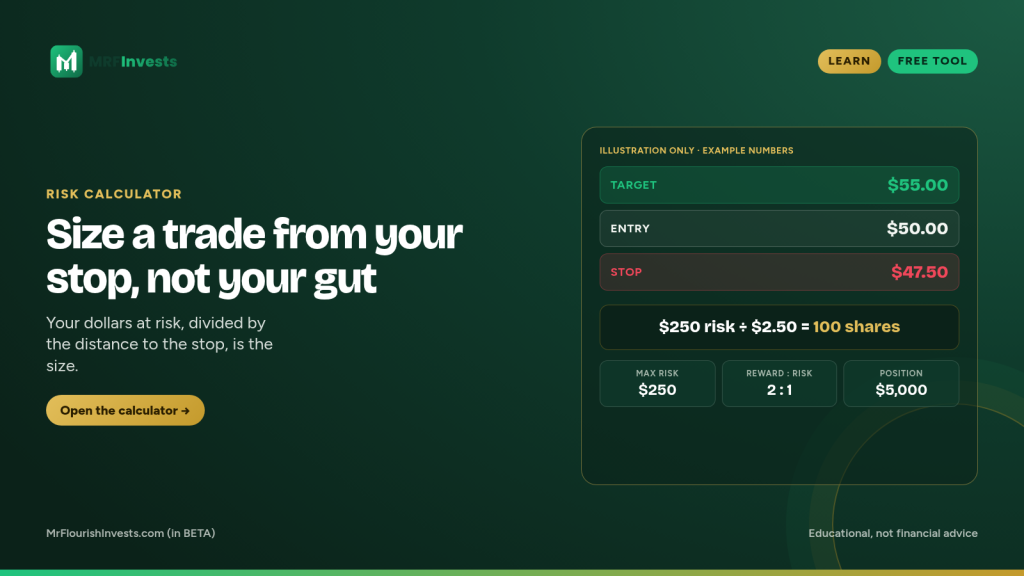
If you risk $250 and the stop sits $2.50 away from the entry, you can hold 100 shares. A tighter stop produces a larger size. A wider stop produces a smaller one. In both cases the dollars at risk stay about the same.
That is the point. Size is the tool that keeps a single idea from taking more than you planned to lose.
A stocks and ETFs example
Open the Risk Calculator and stay on the Stocks / ETFs tab. Use these labeled example values, not a live quote:
- Account size: $25,000
- Risk per trade: 1%, which is $250
- Direction: long
- Size in: shares
- Entry price: $50.00
- Stop price: $47.50
- Target price (optional): $55.00
The stop is $2.50 below the entry, so the risk per share is $2.50. $250 divided by $2.50 is 100 shares. The position is worth $5,000 at entry. If the stop is hit, the loss is $250, which is the 1% you set. If the optional target is reached, the gain is $5.00 a share, or $500, a 2:1 reward-to-risk.
You can size in dollars instead of shares. The calculator will still work from the same stop distance. A short uses the same idea, only the stop sits above the entry. The size still comes from the distance between the two prices.
The 0.5%, 1%, and 2% buttons are shortcuts for the risk field. They are starting points, not a rule. Many people risk less than 1% on a single idea. The right figure is the one that still lets you take the next trade if this one is wrong.
A crypto example
Switch to the Crypto tab. The inputs look familiar, with a few extras: an optional coin, a fee per side, and leverage. Here is another labeled example, this time for bitcoin, not a live price:
- Account size: $25,000
- Risk per trade: 1%, or $250
- Direction: long
- Entry: $80,000
- Stop: $76,000
The stop is $4,000 per coin below the entry. $250 divided by $4,000 is 0.0625 coins. At the $80,000 example entry, that position is worth $5,000. The dollars at risk are still $250.
Enter the fee per side if your venue charges one. A fee on the way in and the way out comes out of the result, so the actual risk is a little larger than the stop distance alone, and the reward-to-risk is a little smaller. If you leave the fee at zero, you are sizing as if those costs do not exist.
Leverage changes how much capital you post, not the fact that a stop can be hit. Used carelessly, it can turn a planned loss into a larger one if the price gaps through the stop. If you do not use leverage, leave it at 1x and size from the stop the same way you would on a stock.
An options example
The Options tab is marked BETA. You type the premium you would pay (or receive), an optional stop premium, an optional target premium, and the contract multiplier, which is often 100 for a standard U.S. equity option.
Labeled example: a long call with a $3.50 premium, a $2.00 stop premium, a $6.50 target premium, and a 100 multiplier. The risk per contract is $1.50 times 100, or $150. Against a $250 risk budget, that is one contract, with $150 of actual risk. Two contracts would be $300, which is more than the $250 cap, so the size stays at one. If the target premium is reached, the gain is $3.00 times 100, or $300, again a 2:1 reward-to-risk on that contract.
Options can expire, move faster than the underlying, and lose value even when the stock goes your way. The calculator sizes the idea from the premiums you enter. It does not replace a plan for expiration, implied volatility, or the right contract to use.
What the other readouts mean
- Position size is how many shares, coins, or contracts fit the risk.
- Max $ risk is the account-level cap you set, such as 1% of $25,000.
- Actual risk is what the chosen size would lose if the stop is hit, which may be a little under the cap when size is rounded down.
- Position value is the size times the entry (or the premium times the multiplier, for options).
- Stop distance is the gap between entry and stop.
- Reward : Risk and potential profit appear when you add a target. They help you see whether the idea pays you enough for the dollars you are putting up, not whether the target will be reached.
The trade map is a picture of that entry, stop, and target. It is there to make the distances easy to see.
What the calculator does not do
It does not pull live quotes, place an order, or promise a fill at your stop. It excludes commissions, slippage, and gaps. A stock, a coin, or an option can open beyond the stop, and the loss can be larger than the number on the screen. Treat the output as a plan for size, then check it against the way your broker actually fills orders.
If you follow a buy or sell idea from the alerts on the homepage, you can still use this calculator to size your own trade. Alert details such as prices, stops, and targets are for members. The article will not list them.
Sunday Letter: tinyurl.com/mrfinvestsmail
Educational only. Not financial advice.
NFA. Everything on this site is for education and entertainment. It is not financial, investment, legal or tax advice.
Related guides
Tool guide
How to Compare Sector Buckets
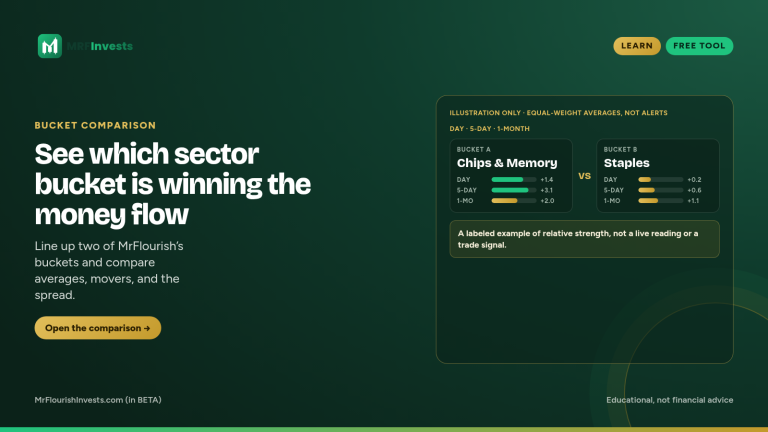
Line up two of MrFlourish’s sector buckets and compare averages, movers, and the spread to see where money is moving.
Read guide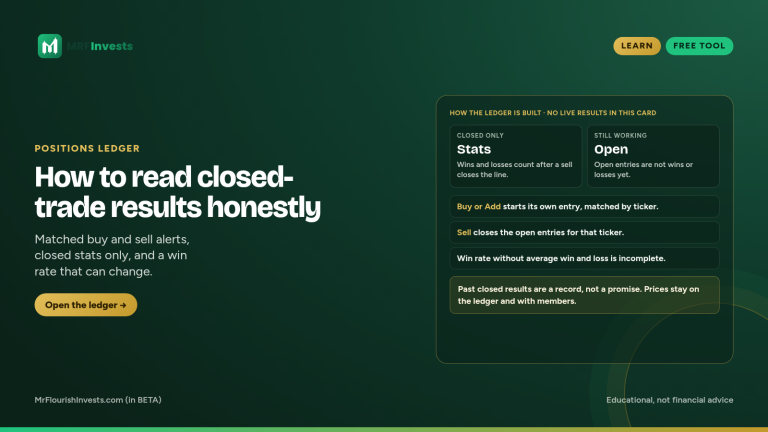
Tool guide
How to Read the Positions Ledger
Learn how to read the Positions Ledger's public closed-trade stats — win rate, average win versus average loss, and average return — and what stays with PRO members.
Read guide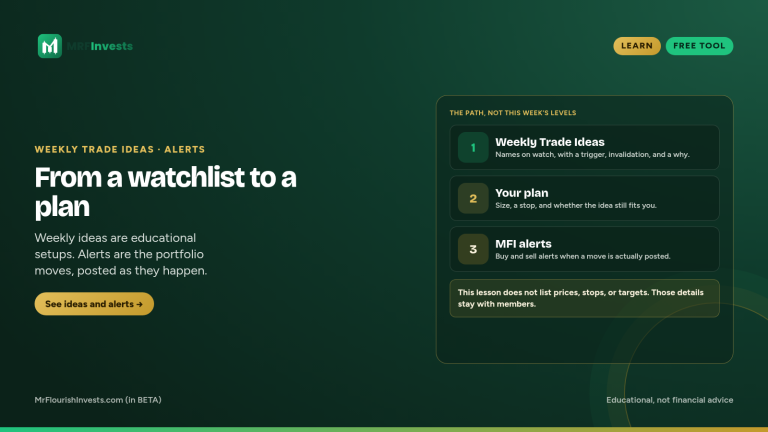
Tool guide
From Weekly Trade Ideas to an MFI Alert
See how Weekly Trade Ideas work as a watchlist and how MFI alerts are the posted portfolio moves, without listing prices, stops, or targets.
Read guide